Interesting idea! Another thing to try is to look at the phonetic transcription. The reason for this is that some words are not emphasizing sound r strongly enough even though its letter is present in the spelling. For instance, compare strong r sound in the beginning of the syllable
In[]:= WordData["rat","PhoneticForm"]
Out[]= rˈæt
to weak r sound at the end of the syllable that is reflected in the absence of r in phonetic transcription
In[]:= WordData["water","PhoneticForm"]
Out[]= wˈɔtɝ
Although in some other languages, like Russian language for example, it would be a bit different -- in a sense that any spelled letter r always maps onto a phonetic sound r. But focusing on English, we can try to explore stats of only on the words with strong phonetic r. We can obtain it for 29795 words with phonetic transcription:
phonetics=DeleteMissing[WordData[#,"PhoneticForm"]&/@WordData[]]
Length[phonetics]

Then we can get the symbols that represent phonetic alphabet removing 2 that do not actually represent any sound:
symbols=DeleteCases[Characters@phonetics//Flatten//Union,"ˈ"|"ˌ"]
{ŋ,ɒ,ɔ,ə,ɛ,ɝ,ɡ,ɪ,ʃ,ʊ,ʌ,ʒ,a,æ,b,d,ð,e,f,h,i,j,k,l,m,n,o,p,r,s,t,u,v,w,z,θ}
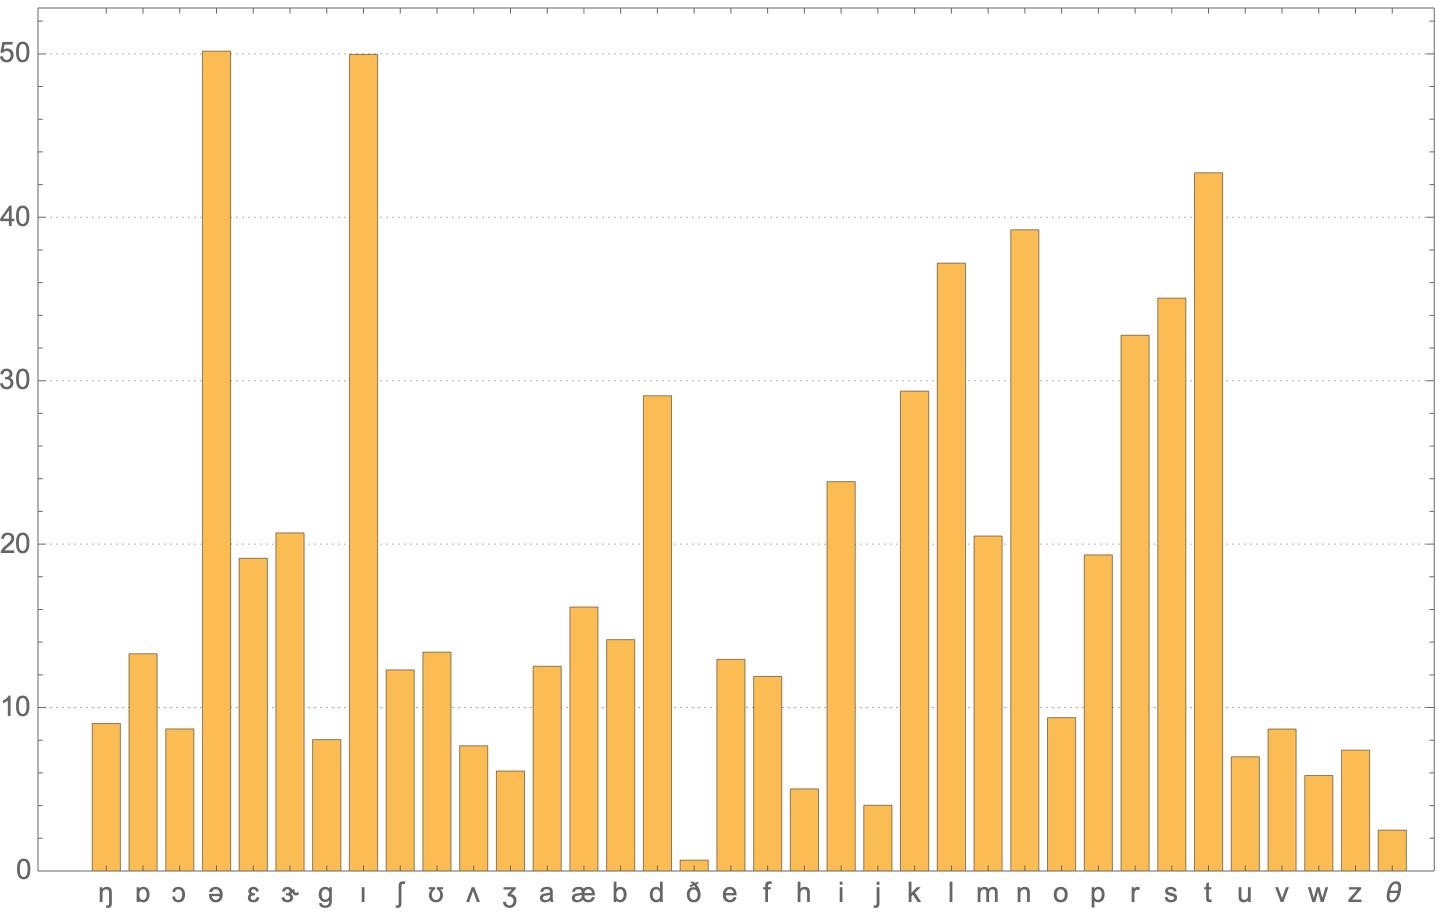
Then we can build your chart based on the phonetic symbols:
BarChart[
Length[Flatten[StringCases[phonetics, ___ ~~ # ~~ ___]]]/
Length[phonetics]100.&/@symbols,
ChartLabels -> symbols, PlotTheme -> "Detailed"]

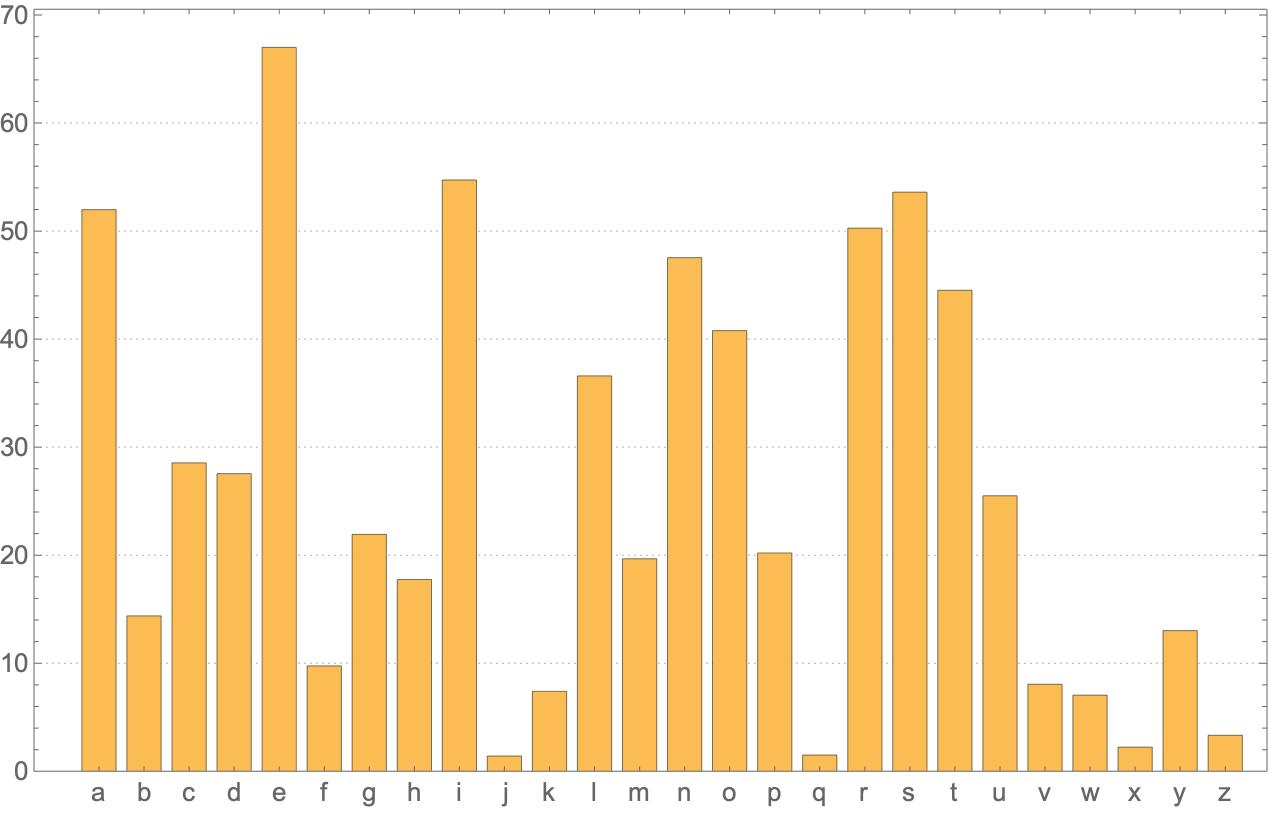
While stats are a bit different the value of sound r is still very high. BTW here is another sample dictionary and a little different code to reproduce your original idea closely:
BarChart[
Length[DictionaryLookup[___ ~~ # ~~ ___]]&/@
Alphabet[]/Length[DictionaryLookup[]] 100.,
ChartLabels -> Alphabet[], PlotTheme -> "Detailed"]
