Message Boards Message Boards

0
|
7785 Views
|
5 Replies
|
6 Total Likes
View groups...
Share
Share this post:

Problem plotting 1/x graph

Posted 11 years ago
Hi, 

I am trying to plot the 2D and 3D graphs of 1/(x+1) function. Everything works fine except the fact that at the point x=-1 (where function turns to infinity) Mathematica plots a vertical line (a vertical surface in 3D plot). Can it be avoided anyhow without losing the precision of the graph and cutting the plot?

Thanks in advance.
Attachments:
5 Replies
Posted 11 years ago
Exit Mathematica.
Start Mathematica.
Literally type into the new blank fresh notebook the following characters:
Plot[1/Sin[x], {x, 0, 15}, Exclusions -> Sin[x] == 0]
Do <shift><enter>
Click File and then Save and save the notebook under a new different name.
Exit Mathematica
Make a new posting and attach exactly that saved notebook showing the results.
Don't do anything else during any of this that might give reason for uncertainty.
All this should show let others load your notebook and see exactly the failure.
Thank you
POSTED BY: Bill Simpson
For me the exclusion command appears to work:
Plot[1/(1 + x), {x, -2, 2}, Exclusions -> (1 + x) == 0]
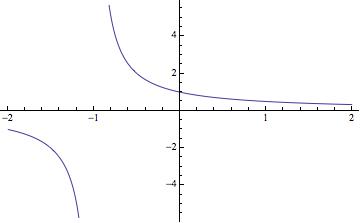


and
Plot[1/Sin[x], {x, 0, 15}, Exclusions -> Sin[x] == 0]
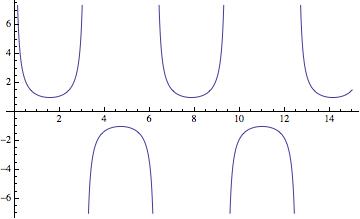


Or even more challenging:
Plot[1/Sin[1/x], {x, -1, 1}, Exclusions -> Sin[1/x] == 0,
PlotRange -> {All, {-20, 20}}]
M
POSTED BY: Marco Thiel
I've tried to use "Exclusions" but it doesn't work. It doesn't give any errors or warnings but it also doesn't make any change in the plot. Exclusions don't work in the following case either:
Plot[1/Sin[x], {x, 0, 15}, Exclusions -> Sin[x] == 0]

It seems like either I am doing something wrong or there is something wrong with my Mathematica. Can you tell me what may be the problem. May be I have to include some library?
The documentation says that Plot breaks curves at discontinuities it detects with the default settings.  That doesn't seem to be working in this case.
POSTED BY: Frank Kampas
Posted 11 years ago
Plot3D[1/(x + 1), {x, -2, 2}, {y, 0, 2}, Exclusions -> x == -1]


Plot[1/(x + 1), {x, -2, 2}, Exclusions -> x == -1]
POSTED BY: Bill Simpson
Reply to this discussion
Community posts can be styled and formatted using the Markdown syntax.
Reply Preview
Attachments
Remove
or Discard

Group Abstract Group Abstract