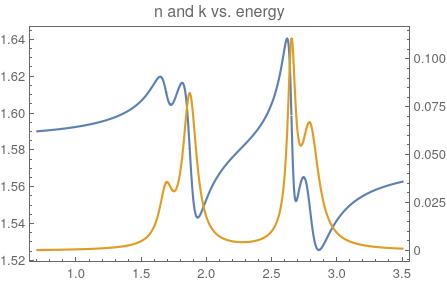
One issue is the formula. There are squares missing in the numerator. Check the section "Extension to multiple oscillators" here. Plots will look better if you change the model as below.
model1[x_] :=
 Sqrt[n + ((c1*a1^2)/((a1*a1) - (x*x) + I*b1*x)) + ((c2*
       a2^2)/((a2*a2) - (x*x) + (I*b2*x))) + ((c3*
       a3^2)/((a3*a3) - (x*x) + (I*b3*x))) + ((c4*
       a4^2)/((a4*a4) - (x*x) + (I*b4*x)))]
I do not know how to account for the sign of the imaginary part. But you can get the expected plots like so:
ResourceFunction["MultipleAxesPlot"][
 Evaluate[{1, -1}*ReIm[model1[x]], {x, 0.60, 3.50},
  PlotLabel -> "n and k vs. energy", PlotRange -> All,
  PlotPoints -> 150]]
