Message Boards Message Boards

0
|
1787 Views
|
2 Replies
|
1 Total Likes
View groups...
Share
Share this post:

Plot an Inequality from intersection point

Hi, someone could explain how to plot an inequality function. I have two models (linear and exponential) and the intersection point. How to combine, join and generate a plot (line)? Thanks, Gustavo

How to plot as continuous line?

POSTED BY: Gustavo Dacanal
2 Replies

Thank you!

POSTED BY: Gustavo Dacanal
Posted 3 years ago

Hi Gustavo,

It is not really going to be continuous. Here is one way

intersection = t /. NSolve[{y1 == y2 && t > 0 && t < 100}, t] // First
combined = Piecewise[{{y1, t < intersection}, {y2, t >= intersection}}]

Plot[combined, {t, 0, 100},
 PlotRange -> {{0, All}, {0, All}},
 Epilog -> {Red, PointSize@Medium, Point[{intersection, y1 /. t -> intersection}]}]
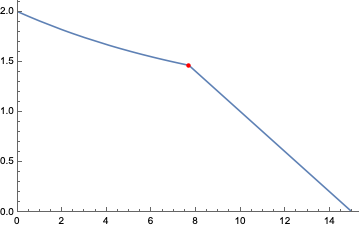
enter image description here

Swapping y1 and y2

combined = Piecewise[{{y2, t < intersection}, {y1, t >= intersection}}]

Plot[combined, {t, 0, 100},
 PlotRange -> {{0, All}, {0, All}},
 Epilog -> {Red, PointSize@Medium, 
   Point[{intersection, y1 /. t -> intersection}]}]
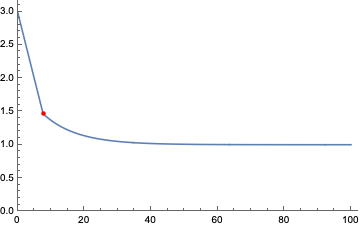
enter image description here

POSTED BY: Rohit Namjoshi
Reply to this discussion
Community posts can be styled and formatted using the Markdown syntax.
Reply Preview
Attachments
Remove
or Discard

Group Abstract Group Abstract