Hi Gustavo,
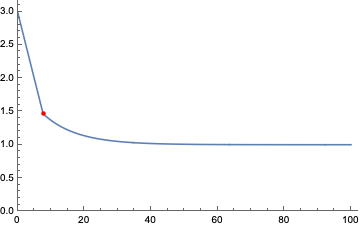
It is not really going to be continuous. Here is one way
intersection = t /. NSolve[{y1 == y2 && t > 0 && t < 100}, t] // First
combined = Piecewise[{{y1, t < intersection}, {y2, t >= intersection}}]

Plot[combined, {t, 0, 100},
 PlotRange -> {{0, All}, {0, All}},
 Epilog -> {Red, PointSize@Medium, Point[{intersection, y1 /. t -> intersection}]}]
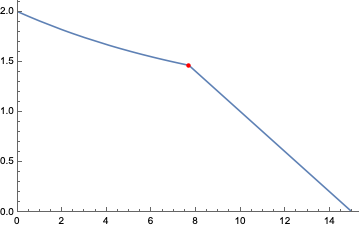
Swapping y1 and y2
combined = Piecewise[{{y2, t < intersection}, {y1, t >= intersection}}]

Plot[combined, {t, 0, 100},
 PlotRange -> {{0, All}, {0, All}},
 Epilog -> {Red, PointSize@Medium,
   Point[{intersection, y1 /. t -> intersection}]}]