Message Boards Message Boards

3
|
7488 Views
|
2 Replies
|
4 Total Likes
View groups...
Share
Share this post:

How can we size a graphic frame, rather than the entire image?

Posted 11 years ago
The following code generates a framed graphic that is4 x 72 points = 4 inches wide.
temp = Graphics[Point[{0, 0}], ImageSize -> 72 4, Frame -> True,
  AspectRatio -> 1/GoldenRatio, PlotRange -> {{80, 300}, {10, 70}},
  FrameTicks -> {{Automatic, None}, {None, None}},
  Background -> Yellow]

And when exported at 300 dpi it generates an image that is 1200 pixels wide, as it should. So indeed this is the correct physical dimension.


The width is the width of the entire image. What I would like to control is the width of the frame inside the image. The reason is that I want to produce graphs whose frame axes are all the same, so they can be easily compared. This does not work with the usual options, because when the graphs have different tick labels and frame labels, they cause the dimensions of the frame inside the image to change to make room.

Can anyone think of a method to force the size of the graphics as produced by ImageSize to be such as to control the size of the frame, with the image sized as needed to include the ticks and labels.

Best regards,
David
POSTED BY: David Keith
2 Replies
Posted 11 years ago
Thanks, Sam -- that got me half way there.

I found that when I extracted ImagePadding as shown there, and then replotted the same plot with the extracted padding, is cut off a tiny amount on the right side. (Note I am working on the horizontal axes, the reference was working on the verticals.)    So I adjusted.

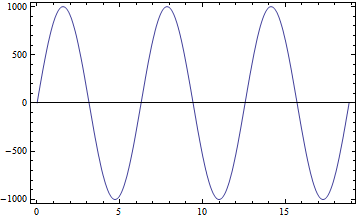
But I did find that if I set both plots ImagePadding to the same amount, and it was adequate, they plotted with the same axis length. They even align in the notebook.

padding = {{30, 5}, {15, 2}};
p5 = Plot[1000 Sin[x], {x, 0, 6 \[Pi]}, Frame -> True,
  ImagePadding -> padding, BaselinePosition -> Axis]
p6 = Plot[Sin[x], {x, 0, 6 \[Pi]}, Frame -> True,
  ImagePadding -> padding, BaselinePosition -> Axis]
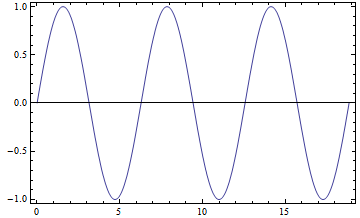

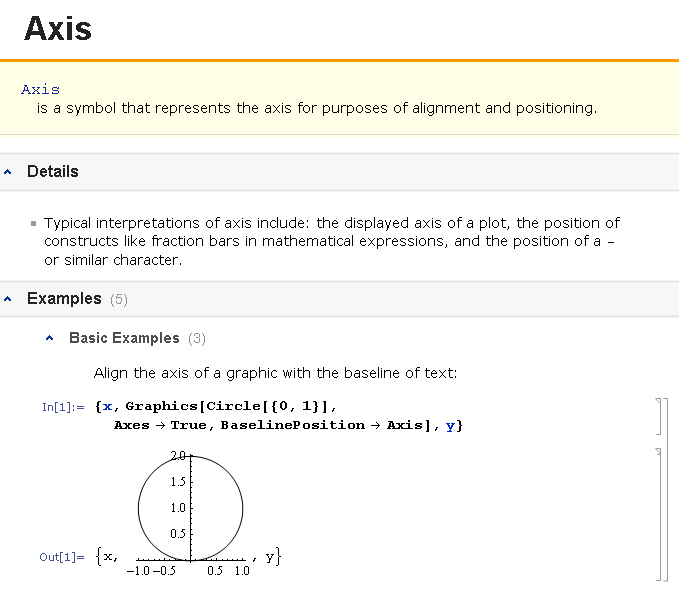
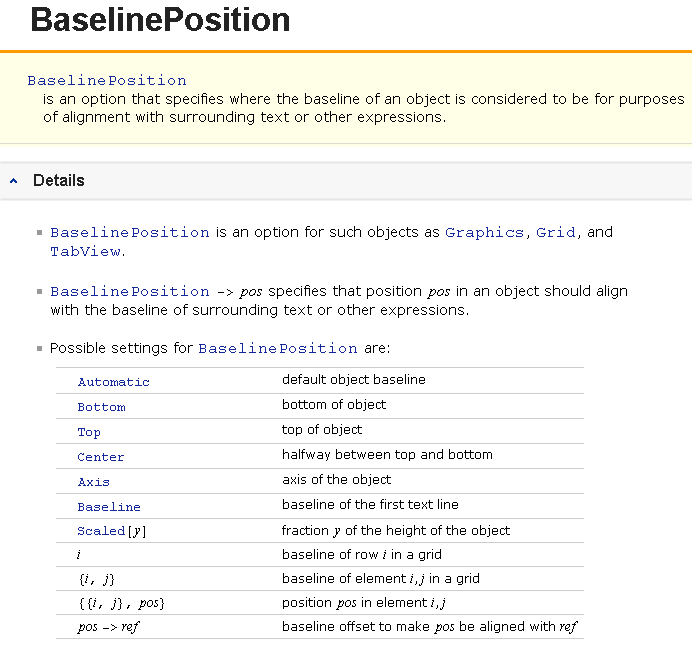
Note that on both plots I set BaselinePosition->Axis, which documentation suggests will set the baseline for alignments to the axis positions for a graphic. (It means other things for other objects.)

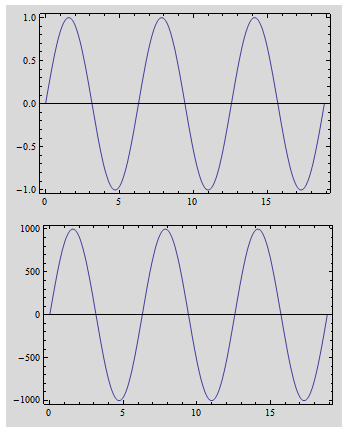
Unfortunately, it appears that GraphicsColumn does not honor the basline position when aligning the two plots. It shifts one of them slightly. I think here it should not, since I believe Center means the center of the entire graphic.
col = GraphicsColumn[{p1, p2}, Alignment -> Center,
  Background -> LightGray]

I figured this is because we need to tell GraphicsColumn to align to baseline, which seems to be an option.
But then I get this:
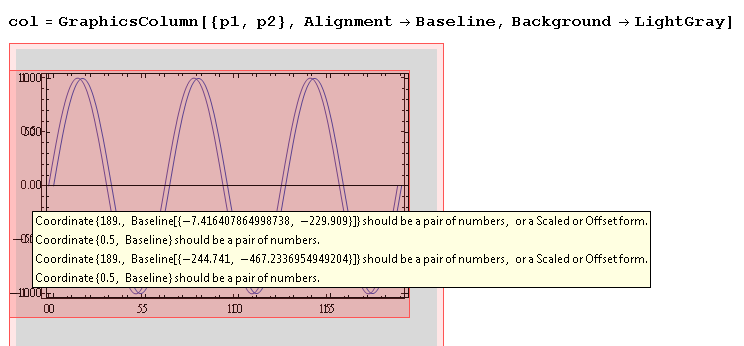

Clearly I am misusing this stuff, but I had hoped the doc below meant GraphicsGrid and its children had a way to align the axes of graphics.
If any of you can offer some insight, I would be grateful.

Best regards,
David

POSTED BY: David Keith
Perhaps some ideas here and in links posted there: How do I make framed plots the same size?
POSTED BY: Sam Carrettie
Reply to this discussion
Community posts can be styled and formatted using the Markdown syntax.
Reply Preview
Attachments
Remove
or Discard

Group Abstract Group Abstract