Thanks, Sam -- that got me half way there.
I found that when I extracted ImagePadding as shown there, and then replotted the same plot with the extracted padding, is cut off a tiny amount on the right side. (Note I am working on the horizontal axes, the reference was working on the verticals.) So I adjusted.
But I did find that if I set both plots ImagePadding to the same amount, and it was adequate, they plotted with the same axis length. They even align in the notebook.
padding = {{30, 5}, {15, 2}};
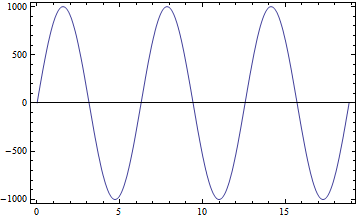
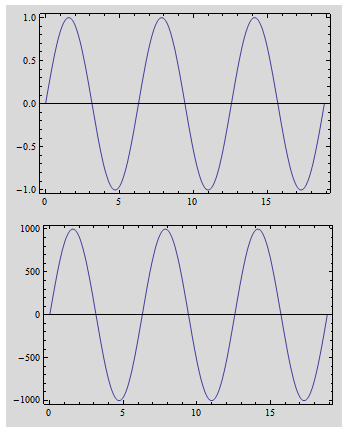
p5 = Plot[1000 Sin[x], {x, 0, 6 \[Pi]}, Frame -> True,
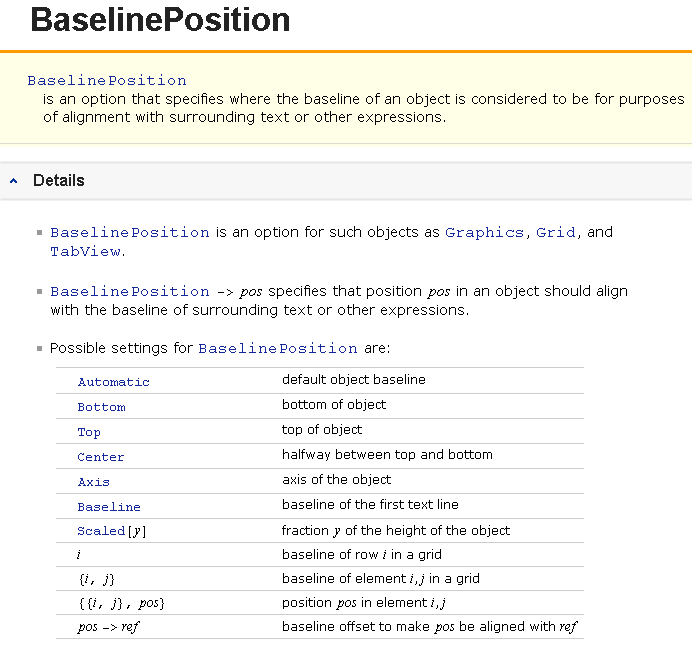
ImagePadding -> padding, BaselinePosition -> Axis]
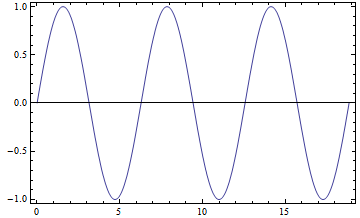
p6 = Plot[Sin[x], {x, 0, 6 \[Pi]}, Frame -> True,
ImagePadding -> padding, BaselinePosition -> Axis]
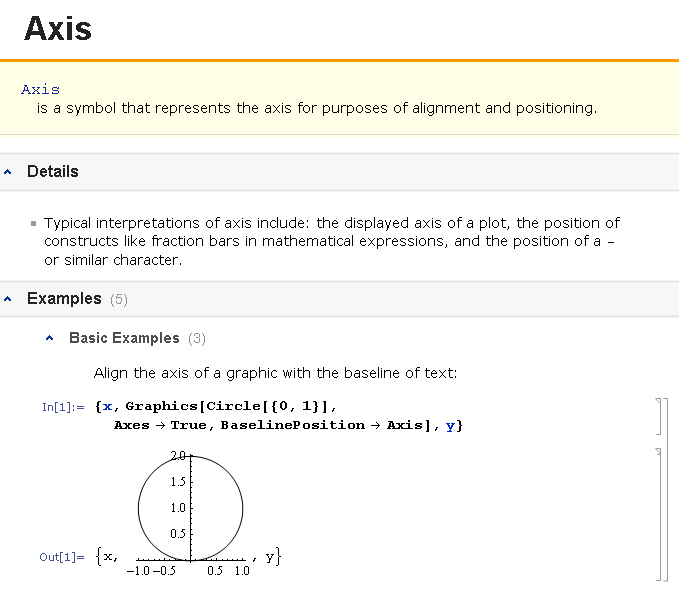
Note that on both plots I set BaselinePosition->Axis, which documentation suggests will set the baseline for alignments to the axis positions for a graphic. (It means other things for other objects.)
Unfortunately, it appears that GraphicsColumn does not honor the basline position when aligning the two plots. It shifts one of them slightly. I think here it should not, since I believe Center means the center of the entire graphic.
col = GraphicsColumn[{p1, p2}, Alignment -> Center,
Background -> LightGray]
I figured this is because we need to tell GraphicsColumn to align to baseline, which seems to be an option.
But then I get this:
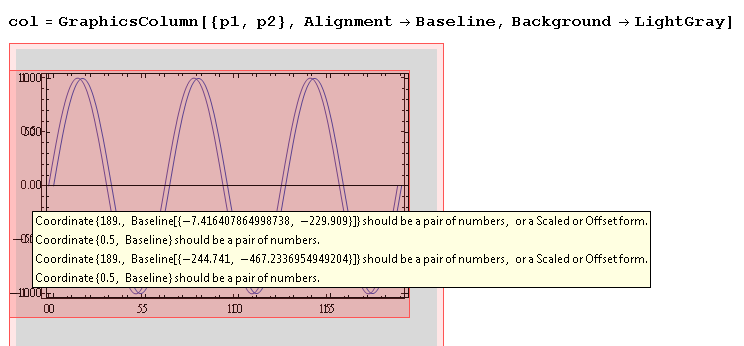
Clearly I am misusing this stuff, but I had hoped the doc below meant GraphicsGrid and its children had a way to align the axes of graphics.
If any of you can offer some insight, I would be grateful.
Best regards,
David