The y range in the example from last year is different. The same scale factor cannot be used, it has to be modified for the current example.
Block[{y = 1},
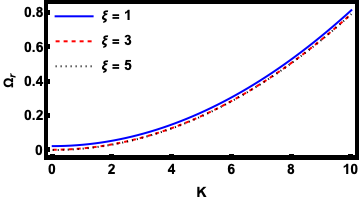
Plot[{Re[x1sol] /. {xi -> 1}, Re[x1sol] /. xi -> 3, Re[x1sol] /. xi -> 5}, {k, 0, 10},
PlotRange -> All,
PlotStyle -> {Directive[Blue, Thick], Directive[Red, Dashed, Thick], Directive[Black, Thick, Dotted]},
Frame -> True,
FrameStyle -> Directive[Black, Thickness@0.0125],
PlotLegends ->
Placed[
LineLegend[{Style["\[Xi] = 1", Bold, 14], Style["\[Xi] = 3", Bold, 14], Style["\[Xi] = 5", Bold, 14]},
LegendFunction -> None,
LegendLayout -> "Column"], {Left, Top}],
FrameLabel -> {"K", "\!\(\*SubscriptBox[\(\[CapitalOmega]\), \(r\)]\)"},
LabelStyle -> Directive[Black, Bold, 14],
RotateLabel -> True,
AspectRatio -> 0.5,
FrameTicks -> {{Charting`ScaledTicks[{10^-28 # &, #/10^-28 &}], None}, {Automatic, None}}]]