Greetings,
I am new to Wolfram, I have a problem, I need to graph this Fourier series in exponential form, but my variable k is in the denominator, this gives me an error, and as it seems it is because at some point my variable k takes a value of zero, creating an indeterminacy. Could you help me solve this problem please, I THANK YOU VERY MUCH.
The range specification for Plot cannot specify a step size. Plot uses adaptive sampling to determine the points to be plotted.
Plot
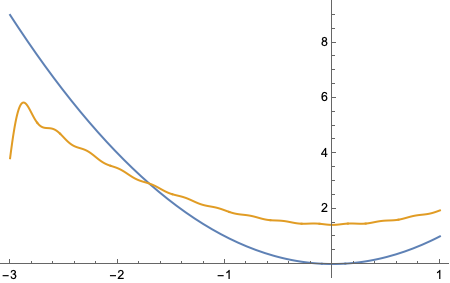
Plot[{t^2, f[t, 20]}, {t, 1, -3}]
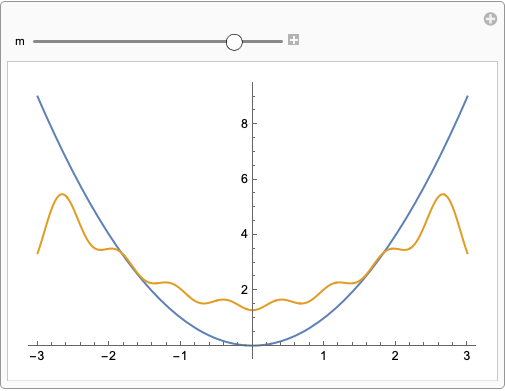
Manipulate[Plot[ {t^2, f[t, m]}, {t, -3, 3}], {m, 1, 10}]