Message Boards Message Boards

Set the plot boundary in ListContourPlot[ ] ?

Posted 2 years ago

I want to set the curved boundaries for the plot output, using the RegionFunction option in the ListContourPlot command. But I am not getting the intended result, as clearly seen from the Mathematrica notebook that I have attached. I have a data set for which I want to generate a ListContourPlot.

I checked that the RegionFunction option in the ContourPlot command works well, but the RegionPlot command does not correctly show the boundaries.

POSTED BY: Yogesh Dandekar

Not sure why its going wrong.

Somehow removing the only two points outside the region changes things

f = Function[{x, y, z}, 
   N[-2 (1 + Sqrt[1 - y]) + (3 + 2 Sqrt[1 - y]) y] < x < 
    N[-2 + 2 Sqrt[1 - y] + 3 y - 2 Sqrt[1 - y] y]];

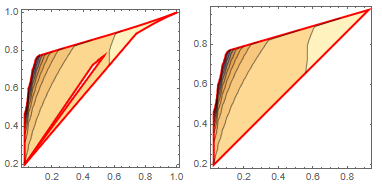
datas = Select[data, f @@ # &];
Select[data, ! (f @@ #) &]

Grid@{ListContourPlot[#, 
     BoundaryStyle -> Directive[Red, Thick], 
     RegionFunction -> f] & /@ {data, datas}}

enter image description here

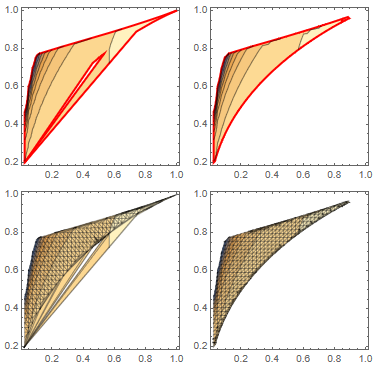
But adding the option MaxPlotPoints imposes a regular grid on your irregular data which seems to solve your issue

Grid@{
  {ListContourPlot[data, RegionFunction -> f, 
    BoundaryStyle -> Directive[Red, Thick]],
   ListContourPlot[data, RegionFunction -> f, 
    BoundaryStyle -> Directive[Red, Thick], MaxPlotPoints -> 40]
   },
  {ListContourPlot[data, RegionFunction -> f, Mesh -> All],
   ListContourPlot[data, RegionFunction -> f, Mesh -> All, 
    MaxPlotPoints -> 40]
   }}

enter image description here

POSTED BY: Martijn Froeling
Reply to this discussion
Community posts can be styled and formatted using the Markdown syntax.
Reply Preview
Attachments
Remove
or Discard

Group Abstract Group Abstract