Message Boards Message Boards

0
|
3680 Views
|
3 Replies
|
0 Total Likes
View groups...
Share
Share this post:

A purple screen appears on graphs when using Opacity

Posted 2 years ago

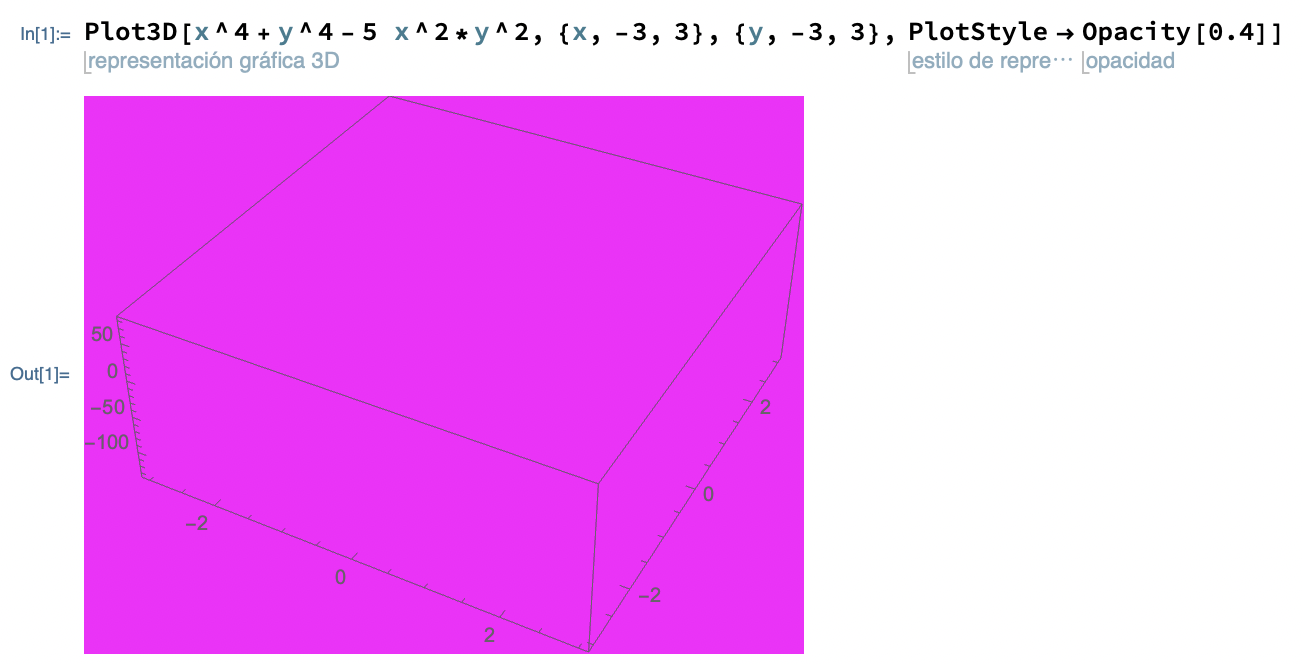
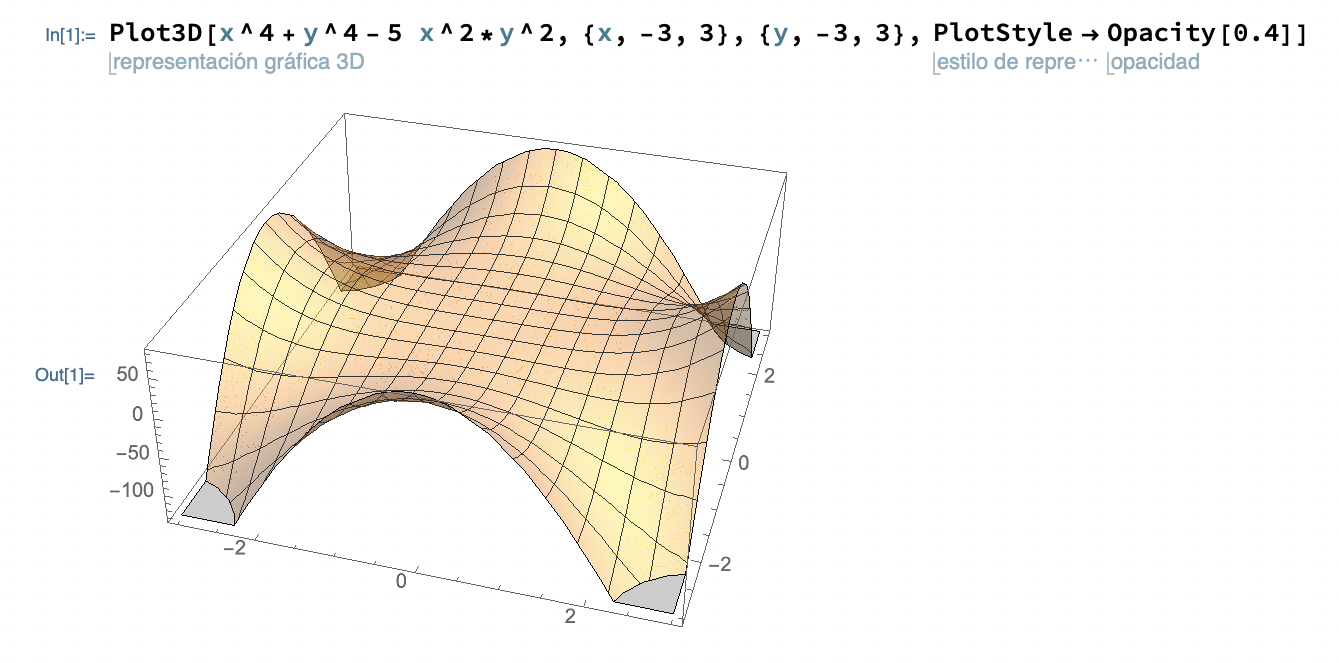
When I try to make a graph with some opacity, the result is a purple screen. If I try to rotate the plot, the graph looks like it should. I stop moving it and again I see a purple screen. I already tried restarting the kernel but it doesn't work. Any idea what could be wrong?

I leave you two screenshots using a new notebook, with the kernel just restarted and using an example that the documentation gives. The first is the output as it is, and the second is when I am rotating it.

This is the code I use, but again, is the one you can find in documentation without any modification:

Plot3D[x^4 + y^4 - 5 x^2*y^2, {x, -3, 3}, {y, -3, 3}, 
 PlotStyle -> Opacity[0.5]]

Thanks in advance. Output Output while rotating axis

POSTED BY: Adán G. Andrade
3 Replies
Posted 2 years ago

I had the same problem. I reduced anti-aliasing quality and it seems it solved the problem. Preferences->Appearance->Graphics Anti-aliasing quality->No anti-aliasing

EDIT: (Mathematica 12.2, MacOS)

POSTED BY: Huseyin Sen
Posted 2 years ago

The problem does not occur with Mathematica 13.0.1 on an HP ZBook 15 G3 laptop using an NVidia M2000M GPU and running Win 10 Pro x64 .

POSTED BY: David Keith
Posted 2 years ago

I've been having the same problem. Working on a Mac. I tried restarting my computer and nothing changed. Any tips would be nice.

POSTED BY: Jacob Lewis
Reply to this discussion
Community posts can be styled and formatted using the Markdown syntax.
Reply Preview
Attachments
Remove
or Discard

Group Abstract Group Abstract