Message Boards Message Boards

0
|
4874 Views
|
4 Replies
|
0 Total Likes
View groups...
Share
Share this post:

A purple screen appears on graphs when using Opacity

Posted 3 years ago

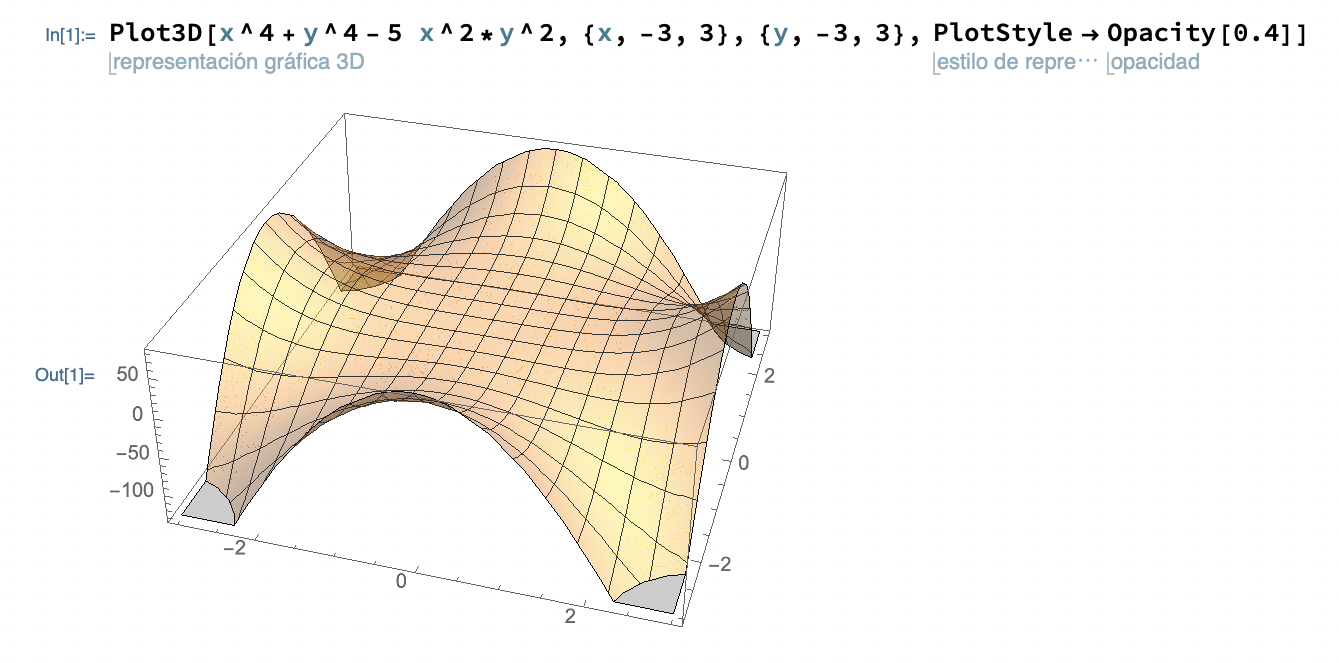
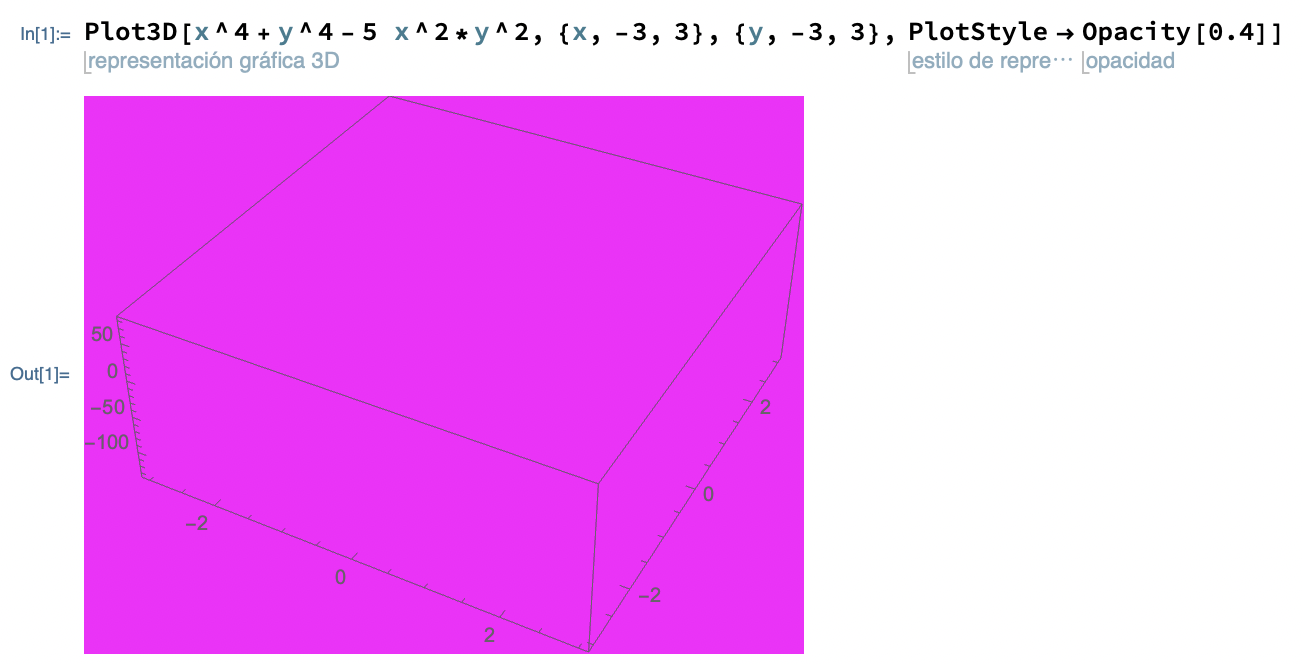
When I try to make a graph with some opacity, the result is a purple screen. If I try to rotate the plot, the graph looks like it should. I stop moving it and again I see a purple screen. I already tried restarting the kernel but it doesn't work. Any idea what could be wrong?

I leave you two screenshots using a new notebook, with the kernel just restarted and using an example that the documentation gives. The first is the output as it is, and the second is when I am rotating it.

This is the code I use, but again, is the one you can find in documentation without any modification:

Plot3D[x^4 + y^4 - 5 x^2*y^2, {x, -3, 3}, {y, -3, 3}, 
 PlotStyle -> Opacity[0.5]]

Thanks in advance. Output Output while rotating axis
POSTED BY: Adán G. Andrade
4 Replies
Posted 3 years ago

I've been having the same problem. Working on a Mac. I tried restarting my computer and nothing changed. Any tips would be nice.

POSTED BY: Jacob Lewis
Posted 3 years ago

The problem does not occur with Mathematica 13.0.1 on an HP ZBook 15 G3 laptop using an NVidia M2000M GPU and running Win 10 Pro x64 .

POSTED BY: David Keith
Posted 3 years ago

I had the same problem. I reduced anti-aliasing quality and it seems it solved the problem. Preferences->Appearance->Graphics Anti-aliasing quality->No anti-aliasing

EDIT: (Mathematica 12.2, MacOS)

POSTED BY: Huseyin Sen

THANKS! I had the same problem and that fixed it.

Reply to this discussion
Community posts can be styled and formatted using the Markdown syntax.
Reply Preview
Attachments
Remove
or Discard

Group Abstract Group Abstract