Group Abstract Group Abstract

Message Boards Message Boards

A one-liner using ListLinePlot3D to visualize a gene

Posted 4 years ago

I had already posted something similar but with the new 12.3.1 function ListLinePlot3D it becomes even easier so I thought it was worth sharing.

You can visualize a nucleic acid sequence in 3d with a few lines of code :

GenomeData["HOXA1", "FullSequence"] //
    Characters //
   # /. {
      "A" -> {1, 1, 1},
      "C" -> {-1, 1, -1},
      "G" -> {-1, -1, 1},
      "T" -> {1, -1, -1}
      } & //
  FoldList[Plus, #] & //
 ListLinePlot3D[#, BoxRatios -> {1, 1, 1}] &

enter image description here

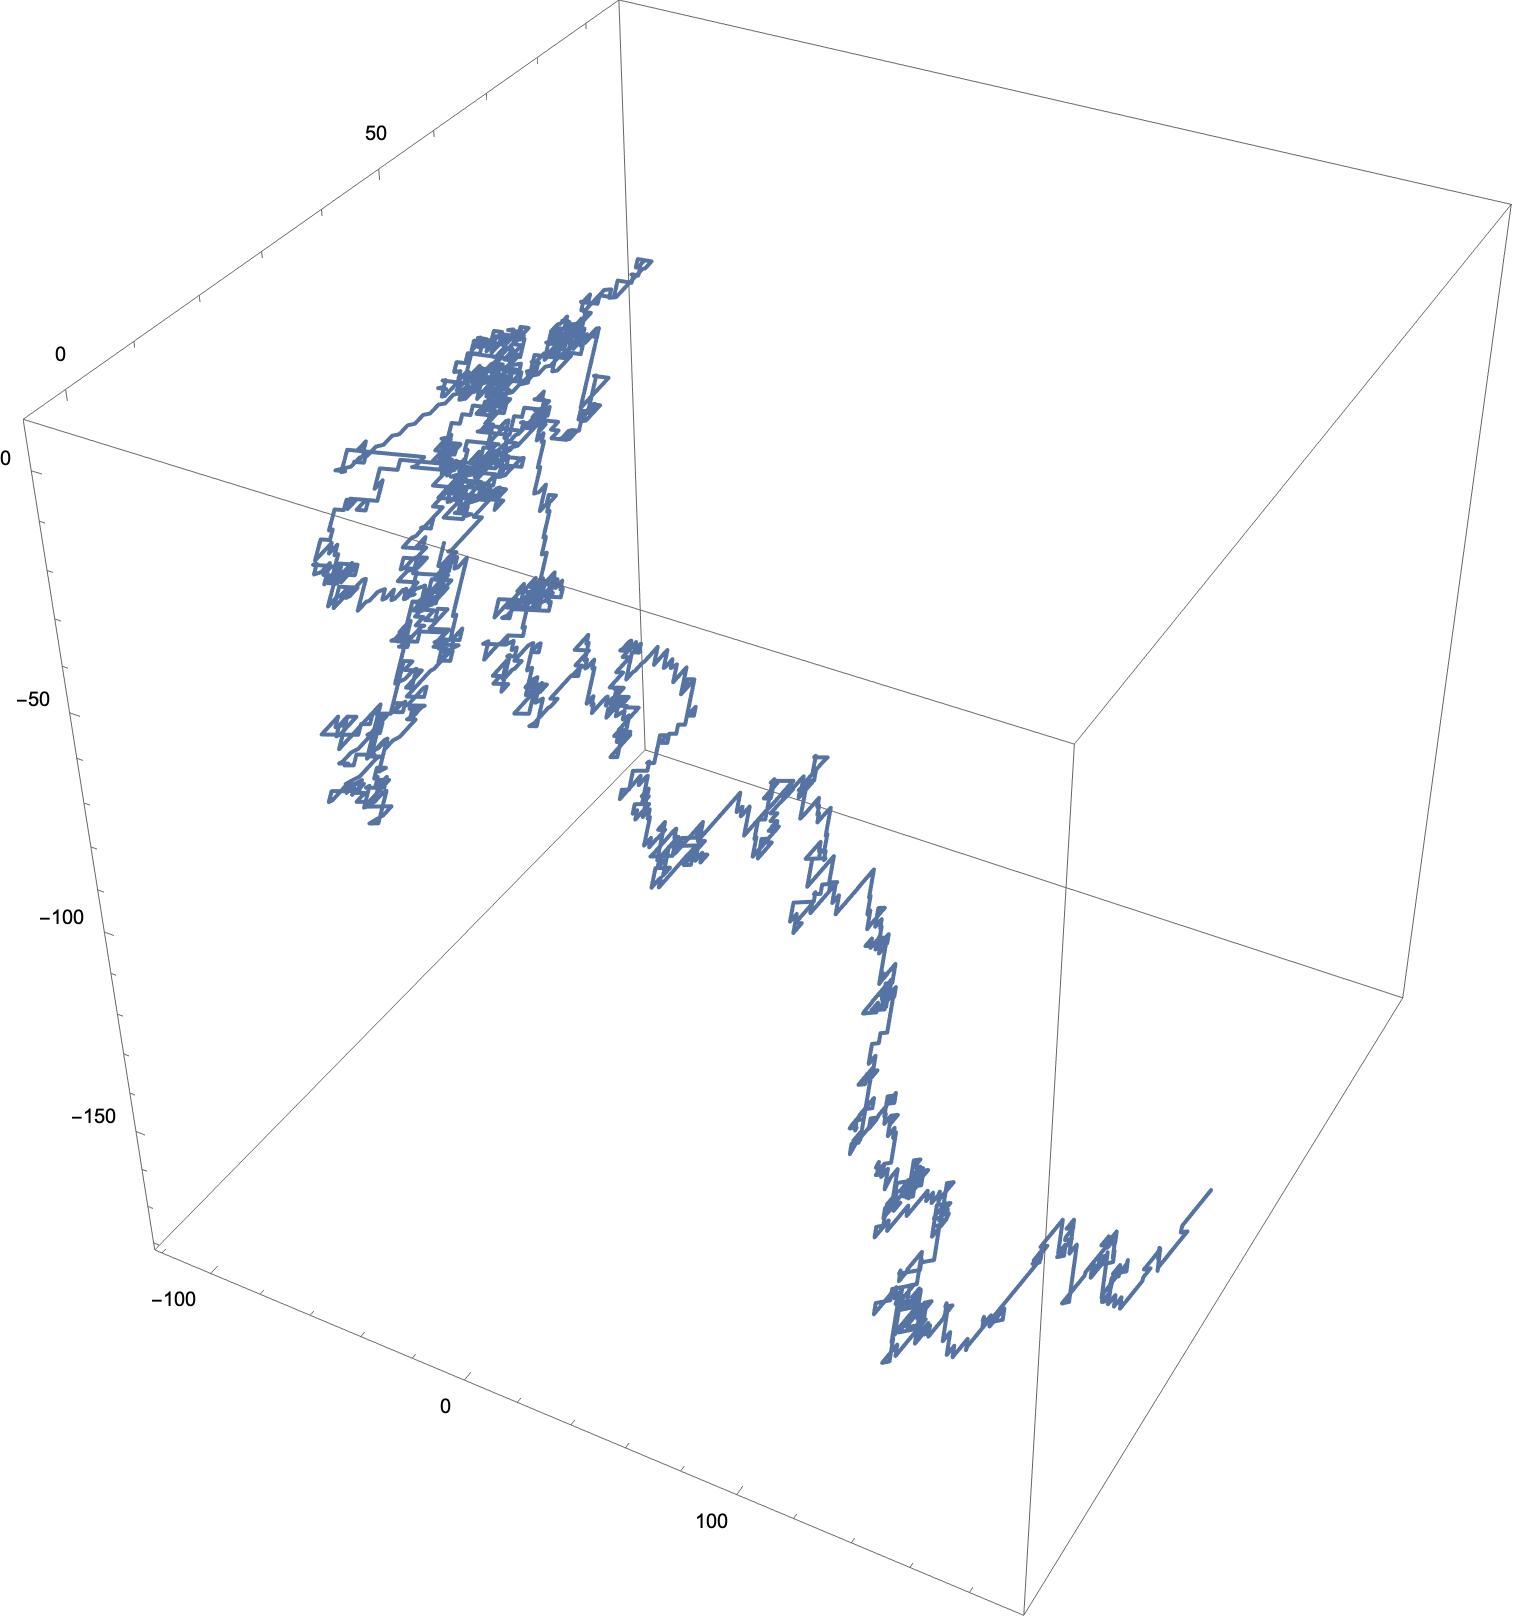
The idea comes from this work : https://youtu.be/IjGZ6kF2gbQ The point is to make it possible to visually compare sequences to see if they are related.

I find that the colors don't matter much. With a long enough chain, they become indiscernable so only the overall shape of the curve is useful.

POSTED BY: Lucien Grondin
2 Replies
POSTED BY: Daniel Lichtblau

I didn't know about Z-curves, thanks. Here is my attempt at implementing it in the Wolfram language :

ZCurve[seq_String] := ListLinePlot3D[
  Transpose[
   {
      (#[["A"]] + #[["G"]]) - (#[["C"]] + #[["T"]]),
      (#[["A"]] + #[["C"]]) - (#[["G"]] + #[["T"]]),
      (#[["A"]] + #[["T"]]) - (#[["C"]] + #[["G"]])
      } &@
    Association[# -> FoldList[
         Plus, 0, Characters@seq /. {# -> 1, _String -> 0}
         ] & /@ Characters@"ACGT"
     ]
   ], BoxRatios -> {1, 1, 1}
  ]

ZCurve[GenomeData["HOXA1", "FullSequence"]]

It's a bit more complicated and less elegant but oh well.

POSTED BY: Lucien Grondin
Reply to this discussion
Community posts can be styled and formatted using the Markdown syntax.
Reply Preview
Attachments
Remove
or Discard