Okay, one more. Then I'd better turn my attention to trimming the hedges and other things my wife thinks are important. Fractals don't impress her much. : )
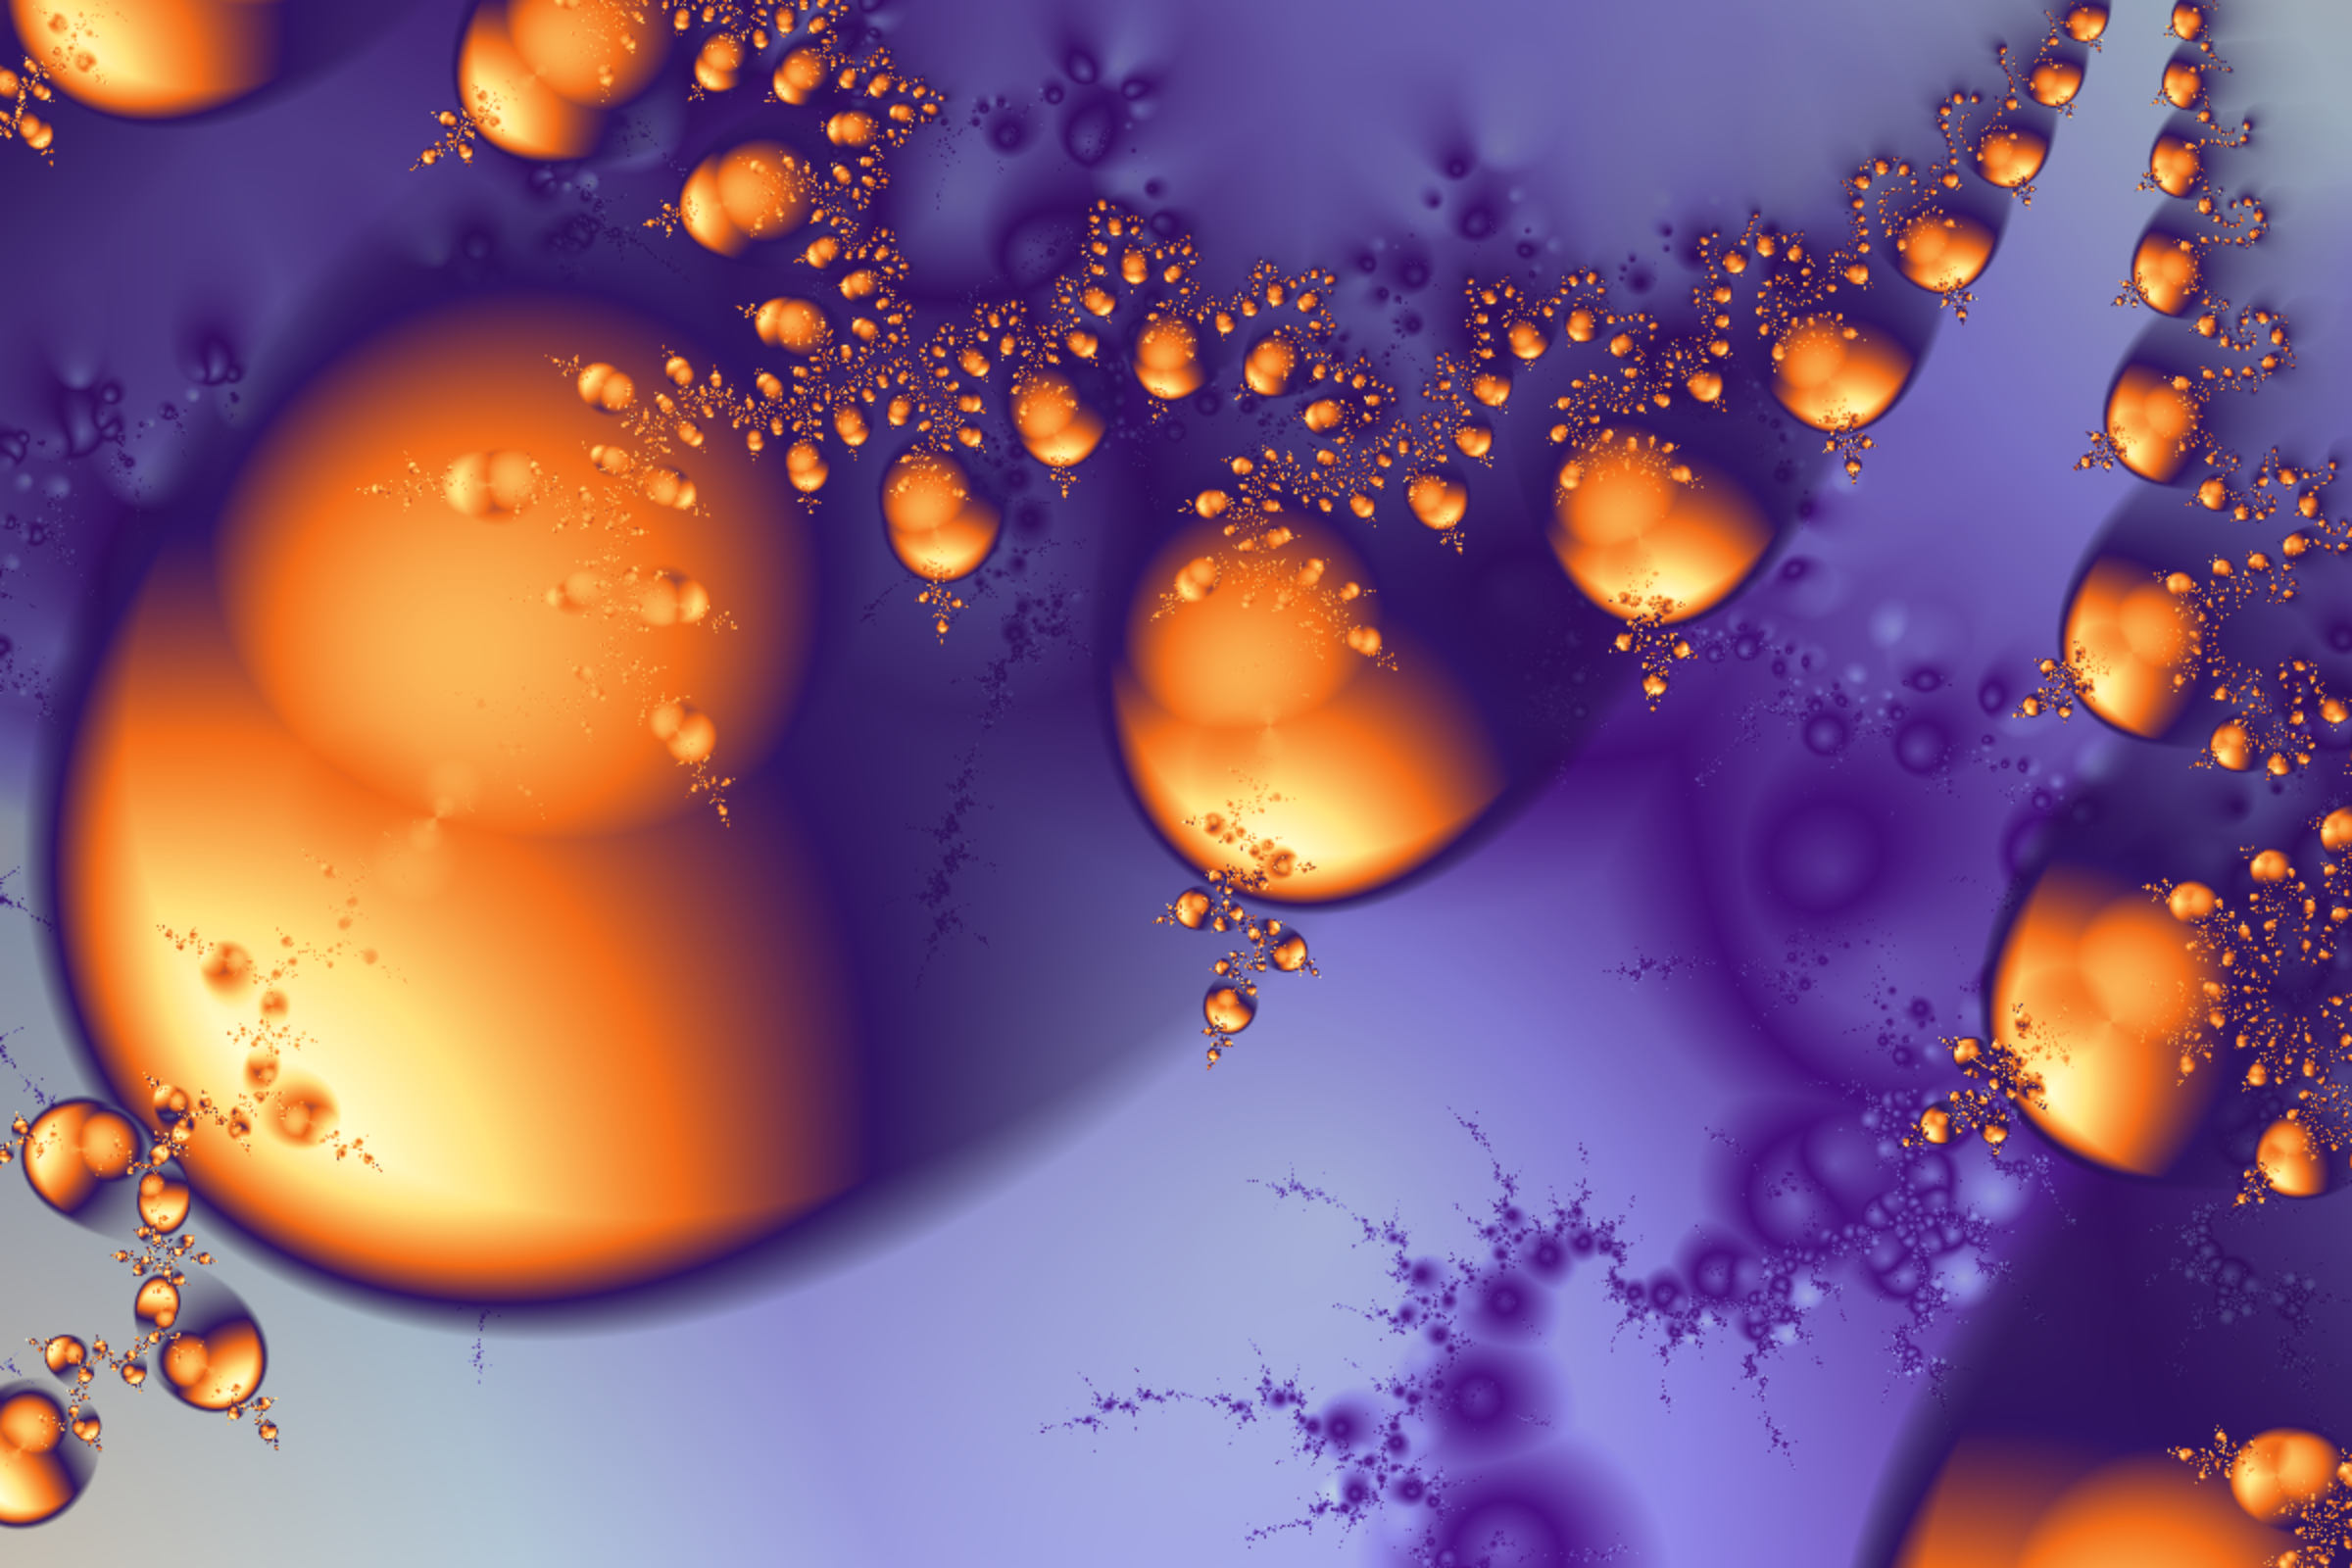
This one has two layers also, the bottom layer's custom mapping is based on the complex distance to the corner coordinates of the image. The custom mapping function for the top layer is similar, but I changed the complex numbers to real plane coordinates with ReIm. Once you get the hang of what's going on in the mapping function, it's pretty easy to explore and come up with some wild and amazing images.
Here's the code:
msr = ResourceFunction["MandelbrotSetRemap"];
myMapping1 =
  Function[{c, center, corner, maxIterations},
   Module[{list, corner2, dist1, dist2},
    corner2 = center + (center - corner);
    dist1 = dist2 = 1000000;
    list = NestWhileList[(
        dist1 = Min[dist1, EuclideanDistance[corner, #]];
        dist2 = Min[dist2, EuclideanDistance[corner2, #]];
        #^2 + c
        ) &,
      0, Abs[#] <= 7 &, 1, maxIterations];
    Abs[dist1 - dist2]]];
img1 = msr[-1.3276 - .06866 I, 108, MaxIterations -> 64, "MappingFunction" -> myMapping1,
  ColorFunction -> ColorData["LakeColors"], ImageSize -> {1200, 800}];

myMapping2 =
  Function[{c, center, corner, maxIterations},
   Module[{list, corner1, corner2, dist1, dist2},
    corner1 = ReIm[corner];
    corner2 = ReIm[center] + (ReIm[center] - corner1);
    dist1 = dist2 = 1000000;
    list = NestWhileList[(
      dist1 = Min[dist1, EuclideanDistance[corner1, #]];
      dist2 = Min[dist2, EuclideanDistance[corner2, #]];
      #^2 + c
    ) &,
  0, Abs[#] <= 7 &, 1, maxIterations];
dist1 - dist2]];
colFn = (Blend[{
  {0, Transparent},
  {.28, RGBColor["#301361"]},
  {.5, RGBColor["#F16A17"]},
  {.77, RGBColor["#FFE07C"]},
  {1, LightYellow}},
 #1] &);
img2 = msr[-1.33 - .1 I, 22, MaxIterations -> 64, "MappingFunction" -> myMapping2,
  ColorFunction -> colFn, ImageSize -> {1200, 800}];
ImageCompose[img1, img2]


