Hello,
I just finished trying to figure out something that wasn't working for me that I want to share. It's not a bug, but a "gotcha".
Turn off Dynamic Enabled from the menu item Evaluation.
Suppose that you had done this earlier and forgotten about the fact that Dynamic was disabled.
Run this:
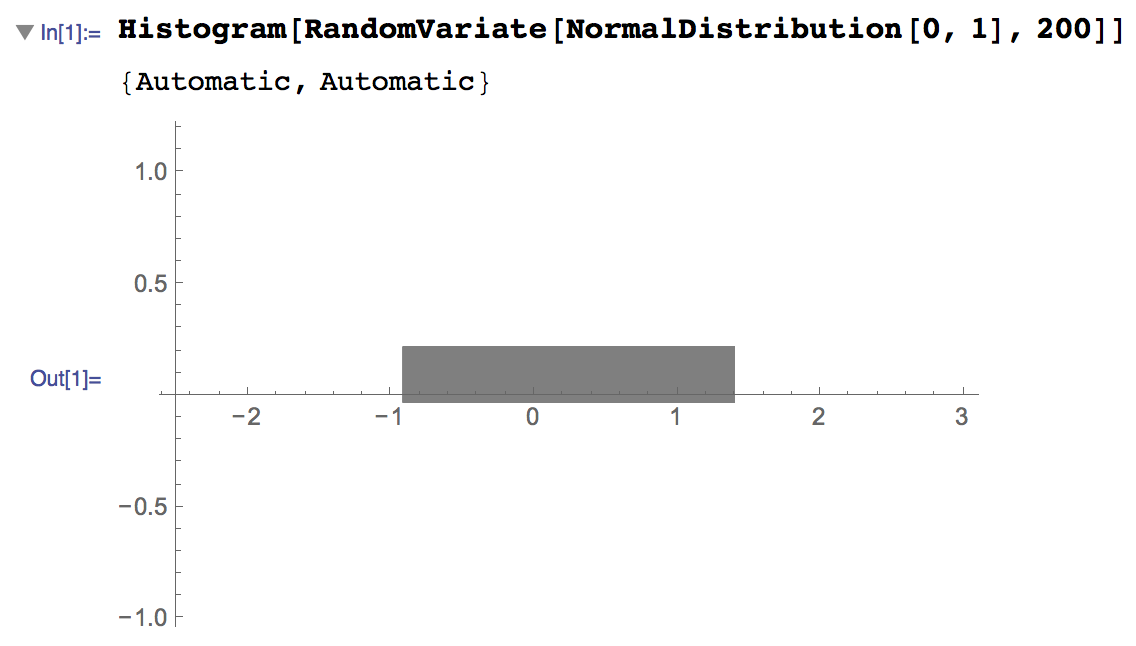
Histogram[RandomVariate[NormalDistribution[0, 1], 200]]
You will get a histogram that you might not expect:

I was confused by this, until I did a haphazard MouseOver the gray region.
It seems reasonable to me that Histogram should show a representative graphic that doesn't require tooltips when Dynamic is off.
Does this seem reasonable to others?