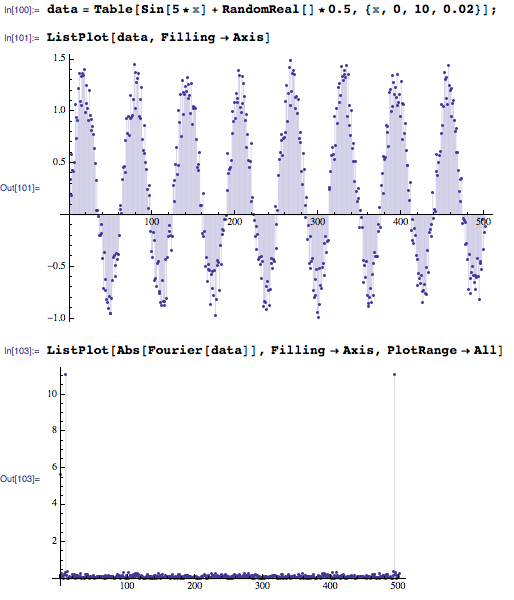
If this happens to be the case, you will introduce some distorsion of your spectrum.
data = Table[Sin[5*x] + RandomReal[]*0.5, {x, 0, 10, 0.02}];
ListPlot[data, Filling -> Axis]
ListPlot[Abs[Fourier[data]], Filling -> Axis, PlotRange -> All]

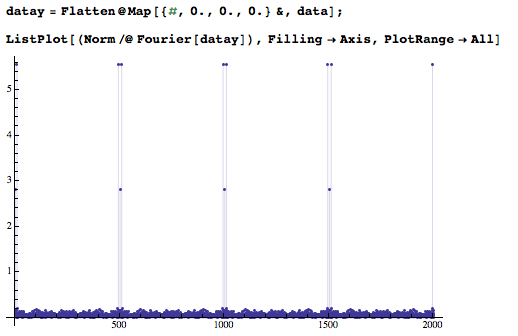
To include the gap, we can use the following code to get the new spectrum:
datay = Flatten@Map[{#, 0., 0., 0.} &, data];
ListPlot[(Norm /@ Fourier[datay]), Filling -> Axis, PlotRange -> All]

These are two useful links:
1. http://www.cs.tut.fi/kurssit/SGN-4010/DSP_kertaus_en.pdf
2. https://reference.wolfram.com/mathematica/tutorial/FourierTransforms.html