I have created a table (Grid) and I can insert it into a DateListPlot with no problem. However, I can't get it positioned where I want it in the lower-right corner.
The problem seems to be that it is positioned based on the center of the Grid, so if I place it in the lower right corner then most of the Grid falls outside of the plot area. Here are two examples:
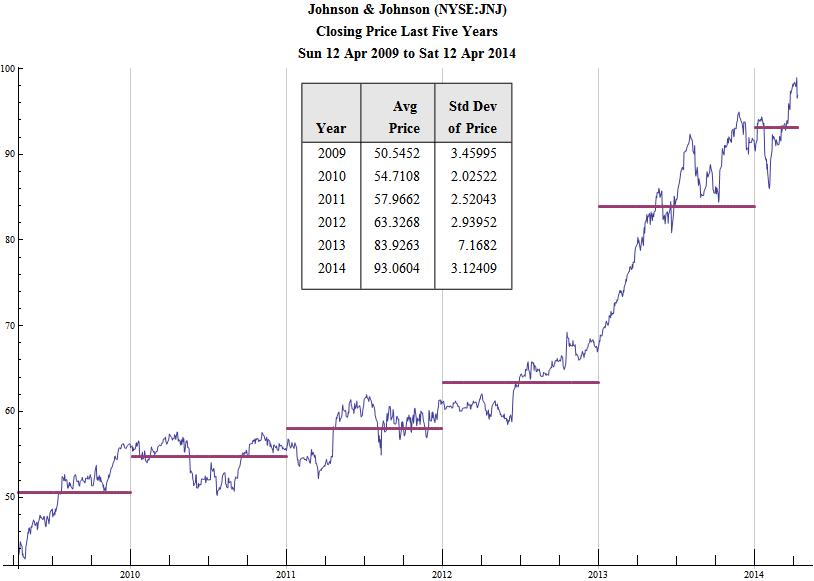
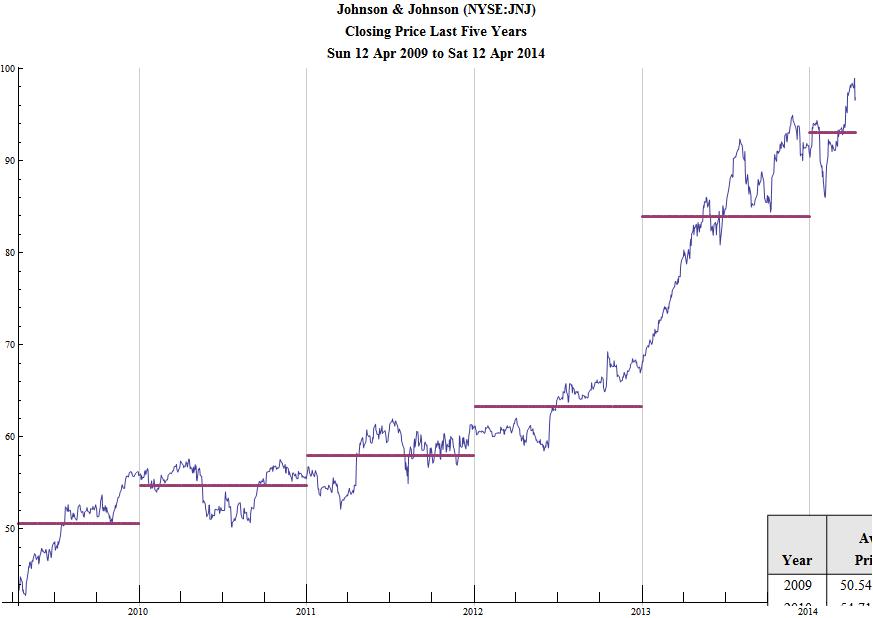
The first is OK for this particular stock, but not what I want. The second is what I want, but the Grid is being cut off. Here is the code used to create the chart:
avgPriceTable =
Style[Grid[
Prepend[Transpose[{yearList, yearPricesMeans,
yearPricesStdDevs}], {Style["\nYear", Bold],
Style["Avg\nPrice", Bold], Style["Std Dev\nof Price", Bold]}],
Alignment -> {Right, Center},
Background -> {None, {GrayLevel[0.9`], {White}}},
Dividers -> {Black, {2 -> Black}}, Frame -> True,
Spacings -> {2, {2, {0.7`}, 2}}], FontFamily -> "Times", 14];
(*Create the price and return plots*)
priceChart =
DateListPlot[{prices, finalMeanPriceList}, Joined -> {True, False},
PlotLabel -> priceChartTitleStr, ImageSize -> Scaled[0.9],
Background -> White,
PlotLegends ->
Placed[{Style["Price", Bold, 12],
Style["Avg Price by Year", Bold, 12]}, Right], Axes -> True,
Frame -> False, Epilog -> Inset[avgPriceTable, {Right, Bottom}]];
The first part creates the Grid (avgPriceTable) and the second part is a DateListPlot that charts the stock price and average price by year. The DateListPlot uses Epilog and Inset to place the table (the code is for the second chart with the Grid in the lower-right.
I would be happy to have the entire Grid show up in the lower-right corner, but I would also like to be able to align it to a specific date.
BTW, the purpose of this exercise is to demonstrate to my students that stock prices are not stationary, so I'm trying to show that the mean price and standard deviation varies over time.I also have another chart that shows that returns are much closer to weak stationarity. I've been playing with MMA for a few years, but on and off, and these types of issues drive me crazy. Any ideas?
BTW, I've tried to use AlignmentPoint as that seems relevant, but I'm not sure where to put it. No matter what I did with it, I seemed to get errors.
Thanks in advance,
Tim


