Message Boards Message Boards

1
|
2889 Views
|
2 Replies
|
5 Total Likes
View groups...
Share
Share this post:

Coloring regions differently in a plot?

Posted 2 years ago

Here is a mock-up of what I want to happen in the top image. But what I've been able to do so far is the bottom image. color bands

Ideally I want color bands selected from an indexed color palette, based on the value of the x axis, with some arbitrary width parameter.

Anyone know how I can achieve this?

2 Replies
Posted 2 years ago

Here's another approach:

With[{list = {1, 3, 6, 10, 15, 21, 25, 27, 27, 25, 21, 15, 10, 6, 3, 
    1}, m = 4},
 With[{data = {Range[Length[list]], list}\[Transpose]}, 
  ListLinePlot[Partition[data, UpTo[m], m - 1], Filling -> Axis, 
   Epilog -> {Thick, Blue, Line[data]}, 
   PlotStyle -> {Green, Magenta, Yellow, Red, Blue}]]]

enter image description here

POSTED BY: Oliver Seipel
Posted 2 years ago

Hi Jonathan,

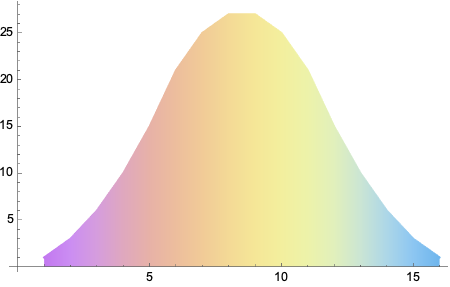
For a continuous color mapping

data = {1, 3, 6, 10, 15, 21, 25, 27, 27, 25, 21, 15, 10, 6, 3, 1};

ListLinePlot[data, 
 ColorFunction -> (ColorData["Pastel"][Rescale[#1, {0, 1}]] &), 
 Filling -> Axis]
enter image description here

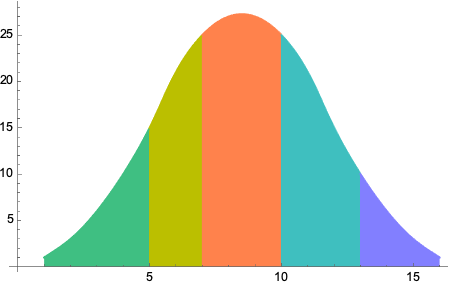
For a discrete mapping to an indexed color, a function that maps x values to an index is needed e.g.

index[x_] = Which[
  x < 5., 1,
  x < 7., 2,
  x < 10., 3,
  x < 13., 4,
  True, 5]

ListLinePlot[data,
 ColorFunction -> (ColorData[88][index[#1]] &),
 Filling -> Axis,
 ColorFunctionScaling -> False,
 InterpolationOrder -> 2]
enter image description here

Without the InterpolationOrder the colors will blend at the edges.

POSTED BY: Rohit Namjoshi
Reply to this discussion
Community posts can be styled and formatted using the Markdown syntax.
Reply Preview
Attachments
Remove
or Discard

Group Abstract Group Abstract