Hi Jonathan,
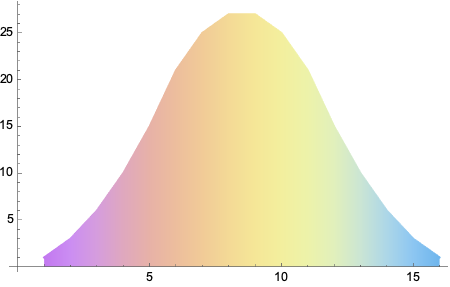
For a continuous color mapping
data = {1, 3, 6, 10, 15, 21, 25, 27, 27, 25, 21, 15, 10, 6, 3, 1};

ListLinePlot[data,
 ColorFunction -> (ColorData["Pastel"][Rescale[#1, {0, 1}]] &),
 Filling -> Axis]
For a discrete mapping to an indexed color, a function that maps x values to an index is needed e.g.
index[x_] = Which[
  x < 5., 1,
  x < 7., 2,
  x < 10., 3,
  x < 13., 4,
  True, 5]

ListLinePlot[data,
 ColorFunction -> (ColorData[88][index[#1]] &),
 Filling -> Axis,
 ColorFunctionScaling -> False,
 InterpolationOrder -> 2]
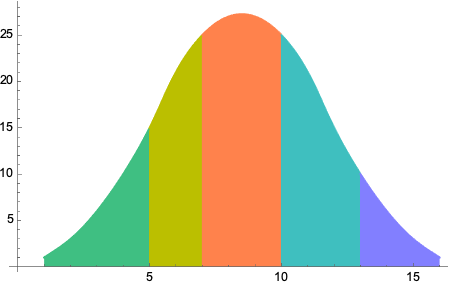
Without the InterpolationOrder the colors will blend at the edges.


