Message Boards Message Boards

0
|
3866 Views
|
4 Replies
|
2 Total Likes
View groups...
Share
Share this post:

Plotting a sequence of Cartesian points using the gradient function

Posted 2 years ago

Could someone please tell me exactly what I need to do, if anything, to the vector calculations given by the Grad[] function to calculate and plot the next subsequent coordinate on a 2D ContourPlot[] using the prior Grad[] function output as input. I would like to continue this process from the beginning given plotted coordinate of P(3,4) to the hottest plotted coordinate of P(0.25,0). Please see attached example and explanation.

I am absolutely sure it is something that I am doing incorrectly or don't understand and would certainly appreciate some guidance in helping me understand what I am doing incorrectly.

Thank you,

Mitch Sandlin

POSTED BY: Mitchell Sandlin
4 Replies

Hope this helps

grad = Grad[fun, {x, y}]
(*gradFunc gives the gradient at a coordinate*)
gradFunc = grad /. Thread[{x, y} -> N[{##}]] &;
(*stepfunc takes two arguemnts #1=coordinate; #2=stepsize*)
(*coor + step * grad[coor]*)
stepFunc = (#1 + #2 gradFunc @@ #1) &;

(*gradFunc takes the coordinate*)
gradFunc[x1, y1]
(*stepfunc takes the coordiante and the stepsize and calculates the \
new coordinate*)
{x2, y2} = stepFunc[{x1, y1}, s]

The NestList is just the easy way to repeatedly apply a function to a previous output to generate the list of coordinates.

These are the same functions without using short notations or pure functions.

gradFunc2[xi_, yi_] := Replace[grad, {x -> xi, y -> yi}]
stepFunc2[coor_, step_] := coor + step Apply[gradFunc, coor];
(*OR*)
stepFunc3[coor_, step_] := coor + step gradFunc[coor[[1]], coor[[2]]];
POSTED BY: Martijn Froeling

Thanks for the quick and thorough explanation - it is a great help.

I have a couple of other minor questions. Why is there a short segment of red line in the solution and does it mean anything? Secondly, how did you come up with the values of stepSize and nSteps? For example, I found that in playing with the values that even a small change creates a significantly different solution and was curious how you came up with the values.

POSTED BY: Mitchell Sandlin
Posted 2 years ago

Your solution is absolutely perfect and does exactly what I wanted. Now, I really need to understand exactly what your code is doing and not being as knowledgeable in pure functions as you apparently are, it is causing me a few issues in understanding your solution, so please bear with me.

I see that you are passing 2 parameters into stepFunction from the function - points. In the first iteration, it seems that you are sending two parameters: (the starting point (3,4) and the stepSize of 2) to the function - gradFunc. What I don't understand is what are you doing with the two parameters in the stepFunction before you execute the gradFunc.

Thanks Again,

Mitch Sandlin

POSTED BY: Updating Name

Is this what you want?
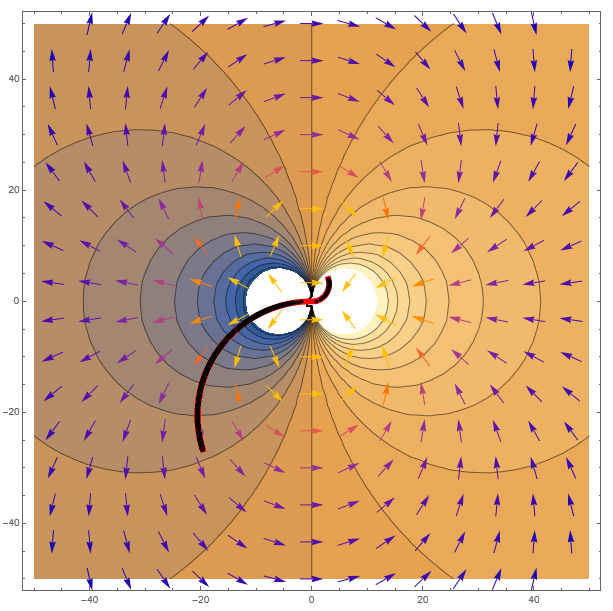
Clear[x, y];
fun = x/(x^2 + y^2);

grad = Grad[fun, {x, y}];
gradFunc = grad /. Thread[{x, y} -> N[{##}]] &;
stepFunc = (#1 + #2 gradFunc @@ #1) &;


nSteps = 8000;
stepSize = 2;

startPoint = {3, 4};
points = NestList[stepFunc[#, stepSize] &, startPoint, nSteps];

rr = 50;

Show[
 ContourPlot[fun, {x, -rr, rr}, {y, -rr, rr}, AxesLabel -> Automatic, 
  ImageSize -> 600],
 VectorPlot[gradFunc[x, y], {x, -rr, rr}, {y, -rr, rr}, 
  VectorScale -> {.03, 1, None}, VectorPoints -> Automatic],
 Graphics[{Red, Thickness[.01], Line[points]}],
 Graphics[{Black, PointSize[Medium], Point[points]}]
 ]

enter image description here

POSTED BY: Martijn Froeling
Reply to this discussion
Community posts can be styled and formatted using the Markdown syntax.
Reply Preview
Attachments
Remove
or Discard

Group Abstract Group Abstract