num = NumberForm[#, {Infinity, 3}] &;
Manipulate[
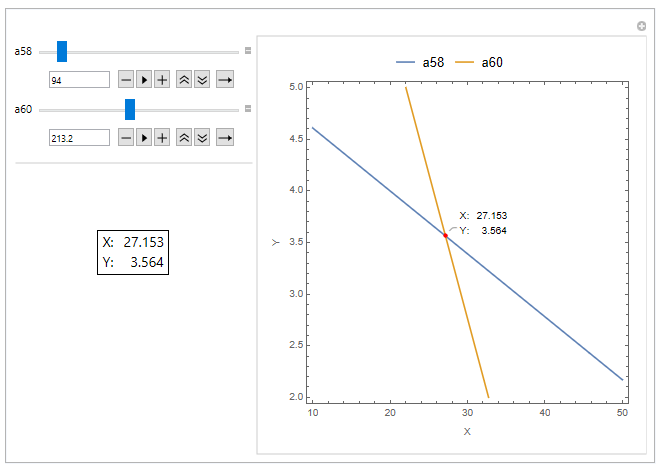
isect = {x, y} /.
NSolve[{-5 x - 82 y == v3 - 522, -1.25 x - 4.45 y ==
v4 - 263}, {x, y}] // First;
coords = Grid[Thread[{{"X:", "Y:"}, num /@ isect}], Alignment -> "."];
ContourPlot[
{-5 v1 - 82 v2 == (v3 - 522), -1.25 v1 - 4.45 v2 == (v4 - 263)},
{v1, 10, 50}, {v2, 2, 5},
PlotLegends -> Placed[{"a58", "a60"}, Above],
FrameLabel -> {"X", "Y"}, Axes -> True, Frame -> True,
Epilog ->
First@ListPlot[{Callout[isect, coords]},
PlotRange -> {{10, 50}, {2, 5}},
PlotStyle -> Directive[Large, Red]]]
,
{{v3, 94, "a58"}, 6, 892, Appearance -> "Open"},
{{v4, 165, "a60"}, 165, 270, Appearance -> "Open"},
{isect, None},
{coords, None},
Delimiter,
Spacer@{0, 50},
Item[Style[Dynamic[coords], 14] // Framed, Alignment -> Center],
ControlPlacement -> Left,
TrackedSymbols :> {v3, v4}]
Using Epilog with Callout you can have your coords in the plot