Attached is an image of a CountourPlot. As you can observe, there is a problem with the contour lines at the center of the plot. I hope it can be repaired soon.
Just set PlotPoints to an odd number, so that the middle point is sure to be included:
PlotPoints
ContourPlot[x^2 - z^2, {x, -10, 10}, {z, -10, 10}, ImageSize -> Large,
  PlotPoints -> 3]
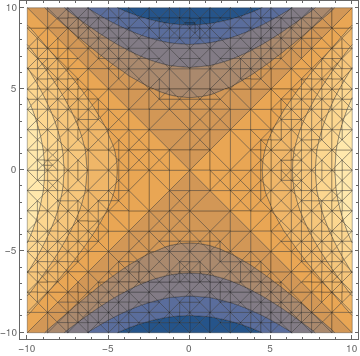
It is possible to see what is going on using the option Mesh -> All, depending on PlotPoints (and MaxRecursion):
Mesh -> All
MaxRecursion
ContourPlot[x^2 - z^2, {x, -10, 10}, {z, -10, 10}, PlotPoints -> 3, Mesh -> All]
I agree, the problem is more complicated. At least I could finalize my work with 3 PlotPoints.
ContourPlot[x^2 - z^2, {x, -10, 10}, {z, -10, 10}, PlotPoints -> 3]
It is more complicated than I thought...
Try PlotPoints->7. The problem still occurs
PlotPoints->7
ContourPlot[x^2 - z^2, {x, -10, 10}, {z, -10, 10}, PlotPoints -> 7]
Thank you.
Thank you, works perfectly.
ContourPlot[x^2 - z^2, {x, -10, 10}, {z, -10, 10}, ImageSize -> Large, PlotPoints -> 60]