Group Abstract Group Abstract

Message Boards Message Boards

1
|
2.8K Views
|
2 Replies
|
3 Total Likes
View groups...
Share
Share this post:

How can I visualize a curve and a plane in the same 3D plot?

For example,

I want to see a line representing the function " z (x , y) = x^2 & y = a constant " intersecting the plane.

Thank you.

2 Replies

Hello!, I'm sorry for the confusion, I actually meant a curve intersecting the plane (I already changed the title).

Good news is that I figured it out:

Still, Thank you for your help!

Posted 4 years ago

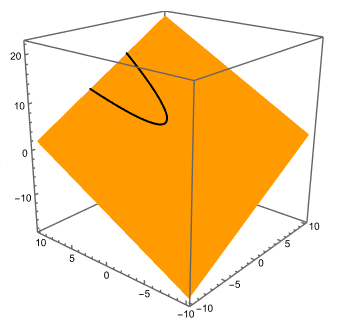
You could use ImplicitRegion and RegionIntersection

regA = ImplicitRegion[z == x + y + 2 && Between[x, {-10, 10}] && Between[y, {-10, 10}], {x, y, z}];
regB = ImplicitRegion[z == x^2 + 4, {x, y, z}];

Show[
    Region[Style[regA, Orange]],
    Region[Style[RegionIntersection[regA, regB], Black, Thick]],
    Boxed -> True, Axes -> True, BoxRatios -> 1
 ]

enter image description here

POSTED BY: Hans Milton
Reply to this discussion
Community posts can be styled and formatted using the Markdown syntax.
Reply Preview
Attachments
Remove
or Discard