Group Abstract Group Abstract

Message Boards Message Boards

Rogue wave: stable fluids algorithm for air/water interface simulation

6 Replies

@Alexander, first of all, this is a wonderful work, thank you very much for sharing! I gave a shout-out on LinkedIN and the feedback was great:

https://www.linkedin.com/feed/update/urn:li:activity:6866071848321368064

I am curious about stable fluid algorithm FDM you mentioned. Is there a general reference to it or it was developed in your report? I know NDSolve does use FDM

but I assume your FDM is a very custom thing.

POSTED BY: Vitaliy Kaurov

Dear Vitaliy, thank you very much for links to NDSolve tutorial and LinkedIn. Actually I have used NDSolve with MOL, DAE and FEM solver as well in different applications. Stably fluids algorithm is very specific for implementation with Mathematica. Every step 1-9 discussed above can be realized with NDSolve, but we prefer Module, Do and Compile with option CompilationTarget -> C to speedup simulation. First time this algorithm has been developed by Jos Stam in the last century for computer graphics applications. For our problem we rebuild this algorithm to make it more stable.

I note that the code has multiple nest Do loops, and does not use NDSolve at all. I expect that there is a better way...

Also, the article does not reference Experimental Evidence of Hydrodynamic Instantons: The Universal Route to Rogue Waves, which is definitely relevant to this work.

POSTED BY: Paul Abbott

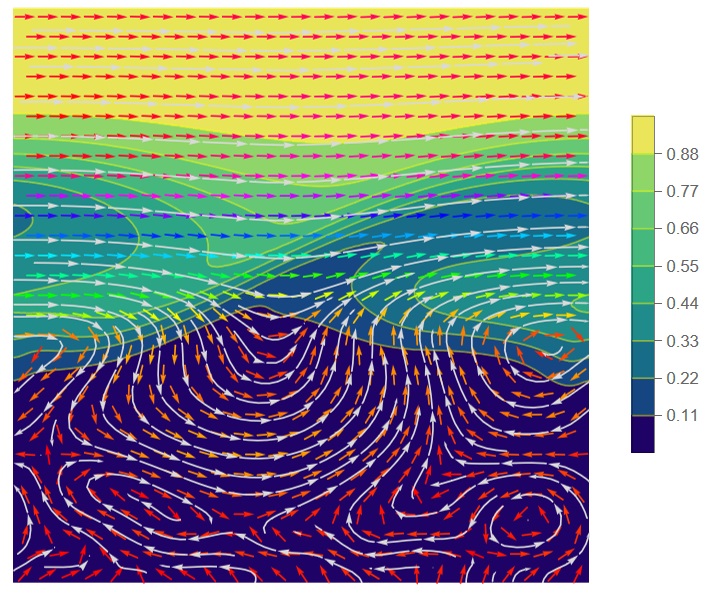
Next step is to animate wave transformation using interface function. We can show velocity field over density as follows

Show[ContourPlot[1 - rh[sm][x, y]/rhoWater20C, {x, 0, 1}, {y, 0, 1}, 
  PlotRange -> All, ColorFunction -> "BlueGreenYellow", Contours -> 8,
   ContourStyle -> Yellow, Frame -> False, PlotLegends -> Automatic], 
 StreamPlot[{Uvel[sm][x, y], Vvel[sm][x, y]}, {x, 0, 1}, {y, 0, 1}, 
  PlotRange -> All, StreamColorFunction -> None, VectorPoints -> Fine,
   VectorColorFunction -> Hue, PlotLegends -> Automatic, 
  StreamColorFunctionScaling -> True, StreamStyle -> LightGray]]

Figure 3

We can also compute frames for animation with using interface function

frames=Table[ContourPlot[1 - rh[i][x, y], {x, 0, 1}, {y, 0, 1}, 
  ColorFunction -> "BlueGreenYellow", Frame -> False, 
  PlotRange -> All, ImageSize -> Small, MaxRecursion -> 2, 
  Contours -> 8, ContourStyle -> Yellow, PlotLabel -> i], {i, 20, sm, 
  20}]; Animate[frames]

enter image description here -- you have earned Featured Contributor Badge enter image description here Your exceptional post has been selected for our editorial column Staff Picks http://wolfr.am/StaffPicks and Your Profile is now distinguished by a Featured Contributor Badge and is displayed on the Featured Contributor Board. Thank you!

POSTED BY: EDITORIAL BOARD
Reply to this discussion
Community posts can be styled and formatted using the Markdown syntax.
Reply Preview
Attachments
Remove
or Discard