I can produce a list of Plots, no problem, with this line of code
MapThread[
 Plot[PDF[NormalDistribution[#1, #2], x], {x, -4, 4}] &, {{0, .1}, {1,
    1.5}}]
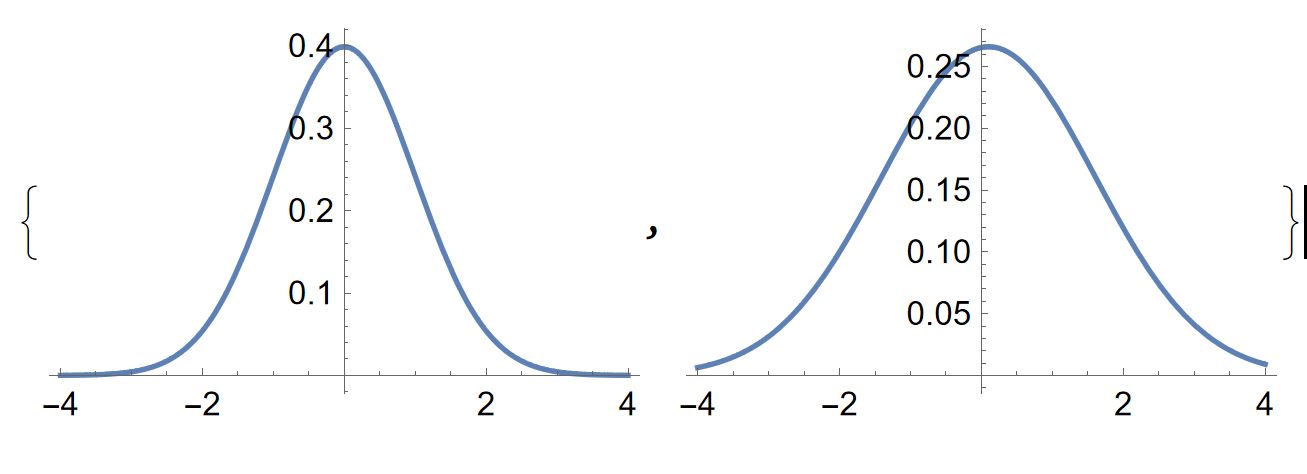
But this code
MapThread[
 Show[Plot[
    PDF[NormalDistribution[#1, #2], x], {x, -4, 4}]] &, {0, .1}, {1,
  1.5}]
Does not produce both plots in the same graphic.


