Message Boards Message Boards

1
|
3469 Views
|
2 Replies
|
2 Total Likes
View groups...
Share
Share this post:

Prediction of next values of a list according to another list

Posted 2 years ago

Dear all,

I have three lists as follows:

x1 = {3285.`, 3283.`, 3382.`, 3423.`, 3330.`, 3380.`, 3452.`,
        3409.`, 3373.`, 3380.`, 3325.`, 3359.`, 3371.`, 3301.`, 3339.`, 
       3421.`, 2573.`};

x2 = {3607.`, 3607.`, 3678.`, 3716.`, 3641.`, 3680.`, 3742.`,
        3706.`, 3676.`, 3683.`, 3650.`, 3676.`, 3688.`, 3641.`, 3653.`, 
       3729.`, 3770.`};

y = {551.147`, 551.158`, 551.158`, 551.175`, 551.174`, 
       551.171`, 551.142`, 551.125`, 551.109`, 551.124`, 551.115`, 
       551.105`, 551.097`, 551.106`, 551.086`, 551.097`, 551.063`};

   Correlation[y, x1]

   0.478399

    Correlation[y, x2]

   -0.337106

Now I would like to predict/estimate the next week's values of y according to x1 and x2 list values using regression or machine learning methods.

enter image description here

Any help would be much appreciated.

POSTED BY: Alex Teymouri
2 Replies
Posted 2 years ago

Hi Ahmed,

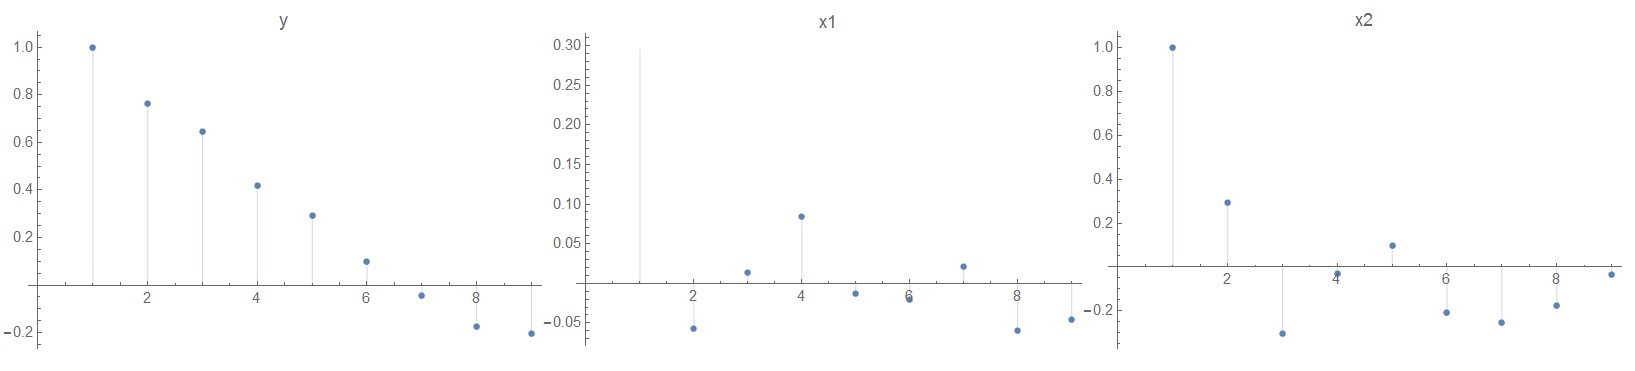
Thank you. I calculated the autocorrelation function for each list.

p1 = ListPlot[CorrelationFunction[y, {8}], Filling -> Axis, 
   PlotLabel -> "y"];

p2 = ListPlot[CorrelationFunction[x1, {8}], Filling -> Axis, 
   PlotLabel -> "x1"];

p3 = ListPlot[CorrelationFunction[x2, {8}], Filling -> Axis, 
   PlotLabel -> "x2"];

Style[Row[{p1, p2, p3}], ImageSizeMultipliers -> {1, ![enter image description here][1]1}]

enter image description here

I think I need a cross-correlation method. As you know, correlation is a linear measure of similarity between two signals. Cross-correlation is somewhat a generalization of the correlation measure as it takes into account the lag of one signal relative to the other. If lag == 0, then correlation = cross-correlation.Cross-correlation is particularly important to assess the causal relationship between two signals in time.

I did some things like the below:

In[10]:= temporalData = TemporalData[{Transpose[{y, x1}]}, Automatic];

In[11]:= correlations = 
 CorrelationFunction[temporalData, {-2, 2}]["Values"]

Out[11]= {{{0.647108, 0.436256}, {-0.0340549, 0.0141987}}, {{0.763739,
    0.289174}, {-0.0396631, -0.0567463}}, {{1., 0.478399}, {0.478399, 
   1.}}, {{0.763739, -0.0396631}, {0.289174, -0.0567463}}, \
{{0.647108, -0.0340549}, {0.436256, 0.0141987}}}

I am not sure about this approach. Please note that we should have a function like this :

Y18= F [ x1 (at t=17), x1(at t=16),...x2(at t=17), x2(at t=16),...,Y17, Y16,Y15,... ]

Thank you so much again, Ahmed.

POSTED BY: Alex Teymouri

Have you tried to use ListPlot to check for the relation between lists? Then you can decide whether to use LinearModelFit, NonlinearModelFit, or other?

POSTED BY: Ahmed Elbanna
Reply to this discussion
Community posts can be styled and formatted using the Markdown syntax.
Reply Preview
Attachments
Remove
or Discard

Group Abstract Group Abstract