Message Boards Message Boards

0
|
2687 Views
|
3 Replies
|
0 Total Likes
View groups...
Share
Share this post:

Iteratively producing plots by changing parameter?

Posted 2 years ago

I want to change the parameter of Γ, output each graph, and then display all the graphs on top of each other. What should i do?

Ug = 1/2; U = -1/12; u = 1/4; s = -13; w = 10; p = -5;Γ= 0.001;

E := 2*s + p + Ug + w;

Em1[y_] := s + p + U + y;

Em2[y_] := s + p + u + y;

Ef[x_, y_] := 2*s + x + y;

I1[y_] := {1/{(Em1[y] - E)^2 + (Pi*Γ)^2}};

I2[y_] := {1/{(Em2[y] - E)^2 + (Pi*Γ)^2}};

S[y_] := (I1[y]/(I1[y] + 2*I2[y]))*Log[2, (I1[y] + 2*I2[y])/I1[y]] + 
   2*I2[y]/(I1[y] + 2*I2[y])*Log[2, (I1[y] + 2*I2[y])/(2*I2[y])];

Plot[S[y], {y, -10, 5}, PlotRange -> All, AxesLabel -> Automatic, 
 PlotPoints -> 10000, 
 GridLines -> {{-2.75, -2.55, -2.41, -1.61}, {0}}, 
 GridLinesStyle -> Red]
POSTED BY: Ryo Tanaka
3 Replies

In the functions I1 and I2 your are using {} where I think () is needed, you don't need to generate a list. Your functions can be evaluated for a list of values of Gamma if you rewrite your functions to take Gamma as an input. That way you can use a list of Gamma functions directly in the plot function.

Also I don't think this plot needs 10000 PlotPoints to show all the details you need.

Ug = 1/2; U = -1/12; u = 1/4; s = -13; w = 10; p = -5;
\[CapitalGamma] = {0.001, .1, 1., 2, 4, 6, 8, 10, 20};
e = 2*s + p + Ug + w;

Em1[y_] := s + p + U + y;
Em2[y_] := s + p + u + y;

Ef[x_, y_] := 2*s + x + y;

I1[y_, \[CapitalGamma]_] := 
  1/((Em1[y] - e)^2 + (Pi*\[CapitalGamma])^2);
I2[y_, \[CapitalGamma]_] := 
  1/((Em2[y] - e)^2 + (Pi*\[CapitalGamma])^2);

S[y_, \[CapitalGamma]_] := (I1[
       y, \[CapitalGamma]]/(I1[y, \[CapitalGamma]] + 
        2*I2[y, \[CapitalGamma]]))*
    Log[2, (I1[y, \[CapitalGamma]] + 2*I2[y, \[CapitalGamma]])/
      I1[y, \[CapitalGamma]]] + 
   2*I2[y, \[CapitalGamma]]/(I1[y, \[CapitalGamma]] + 
       2*I2[y, \[CapitalGamma]])*
    Log[2, (I1[y, \[CapitalGamma]] + 2*I2[y, \[CapitalGamma]])/(2*
        I2[y, \[CapitalGamma]])];

Plot[Evaluate@S[y, \[CapitalGamma]], {y, -10, 5}, PlotRange -> All, 
 AxesLabel -> Automatic, 
 GridLines -> {{-2.75, -2.55, -2.41, -1.61}, {0}}, 
 GridLinesStyle -> Red, PlotLegends -> \[CapitalGamma]]

enter image description here

POSTED BY: Martijn Froeling

You can use Manipulate:

Ug = 1/2; U = -1/12; u = 1/4; s = -13; w = 10; p = -5;
myE = 2*s + p + Ug + w;
Em1[y_] := s + p + U + y;
Em2[y_] := s + p + u + y;
Ef[x_, y_] := 2*s + x + y;
I1[y_, \[CapitalGamma]_] := {1/{(Em1[y] - 
         myE)^2 + (Pi*\[CapitalGamma])^2}};
I2[y_, \[CapitalGamma]_] := {1/{(Em2[y] - 
         myE)^2 + (Pi*\[CapitalGamma])^2}};
S[y_, \[CapitalGamma]_] := (I1[
       y, \[CapitalGamma]]/(I1[y, \[CapitalGamma]] + 
        2*I2[y, \[CapitalGamma]]))*
    Log[2, (I1[y, \[CapitalGamma]] + 2*I2[y, \[CapitalGamma]])/
      I1[y, \[CapitalGamma]]] + 
   2*I2[y, \[CapitalGamma]]/(I1[y, \[CapitalGamma]] + 
       2*I2[y, \[CapitalGamma]])*
    Log[2, (I1[y, \[CapitalGamma]] + 2*I2[y, \[CapitalGamma]])/(2*
        I2[y, \[CapitalGamma]])];
Manipulate[
 Plot[S[y, \[CapitalGamma]], {y, -10, 5}, PlotRange -> All, 
  AxesLabel -> Automatic, PlotPoints -> 10000, 
  GridLines -> {{-2.75, -2.55, -2.41, -1.61}, {0}}, 
  GridLinesStyle -> Red],
 {{\[CapitalGamma], 0.001}, 0, .1}]
POSTED BY: Gianluca Gorni
Posted 2 years ago

Hi Ryo,

E is a built-in symbol representing the mathematical constant e. It cannot be assigned a value

E := 2*s + p + Ug + w;

Here is one way to do this

e = 2*s + p + Ug + w; (* Use e, not E *)

plots = Table[
  Plot[S[y], {y, -10, 5},
   PlotRange -> All,
   AxesLabel -> Automatic,
   PlotLabel -> "Γ" <> " = " <> ToString@Γ,
   PlotLabels -> "Γ" <> " = " <> ToString@Γ,
   GridLines -> {{-2.75, -2.55, -2.41, -1.61}, {0}},
   GridLinesStyle -> Red],
  {Γ, {0.001, .1, 1., 2, 4, 6, 8, 10, 20}}];
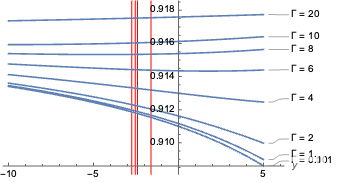
Single plot

Show[plots, PlotRange -> All, PlotLabel -> None]
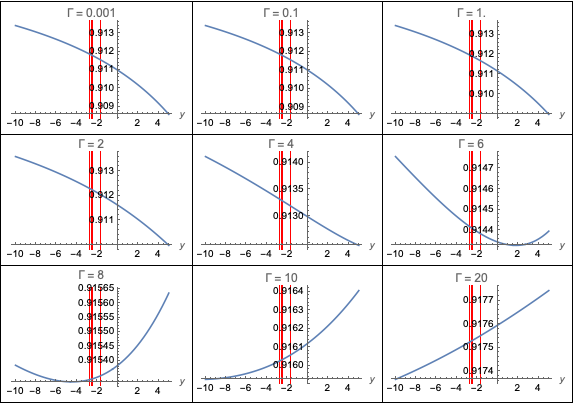
enter image description here

Multiple plots

plots // Partition[#, UpTo@3] & // Grid[#, Frame -> All] &

enter image description here

You can change the specific values for Γ by changing this list

{0.001, .1, 1., 2, 4, 6, 8, 10, 20}
POSTED BY: Rohit Namjoshi
Reply to this discussion
Community posts can be styled and formatted using the Markdown syntax.
Reply Preview
Attachments
Remove
or Discard

Group Abstract Group Abstract