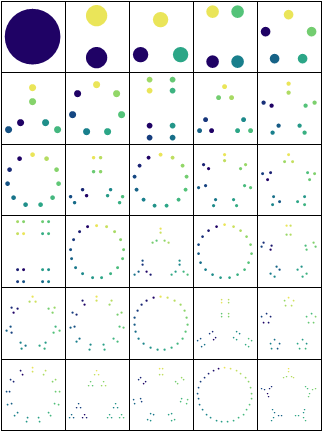
Szabolcs found a
cool page with some JavaScript code that animates transitions between prime factorization diagrams. They can be pretty hypnotic. I volunteered to take a shot at a Mathematica implementation. The code is pretty short, and the transitions are pretty basic so you can expand on them however you want (add pauses between transitions, ease-in/ease-out to the keyframes, etc). The JavaScript code is about 5500 characters and the Mathematica code is about 600. The JavaScript version does allow rewinding and has a little text display in the corner, but even with those additions the Mathematica code would still be vastly shorter.


DynamicModule[{shapes, t, n, next, keyframes},
shapes[i_] :=
Thread@{Table[
ColorData["BlueGreenYellow"]@Rescale[a, {1, i}], {a, i}],
Disk /@ First@
Fold[Module[{pts = #[[1]], r = #[[2]],
n = #2}, {Join @@
Table[# + n r Through@{Cos, Sin}[a 2 Pi/n + Pi/2] & /@
RotationTransform[a 2 Pi/n + If[n == 2, Pi/2, 0]]@
pts, {a, n}], n r}] &, {{{0., 0.}}, 1},
Join @@ ConstantArray @@@ FactorInteger@i]};
t = 1;
n = 1;
next[] :=
keyframes =
Thread[{Prepend[#, #[[1]]], #2} & @@ (shapes /@ {n, n + 1})];
next[];
Dynamic[If[(t += .02) >= n + 1, n++; next[]];
Graphics[{Blend[{#[[1]], #2[[1]]}, t - n],
Disk[#[[2, 1]] + (t - n) (#2[[2, 1]] - #[[2, 1]])]} & @@@
keyframes, PlotRange -> t*{{-2, 2}, {-2, 2}}, AspectRatio -> 1,
ImageSize -> 300]]]