Message Boards Message Boards

Manipulate function not showing smooth transition of a variable

Posted 2 years ago

Here is my code

ClearAll["Global`*"];
\[Lambda] = 1;
\[Beta] = ArcSin[\[Lambda]/Sqrt[1 + \[Lambda]^2] ];
T[r_, \[Zeta]_, F_, \[Epsilon]_] :=
  With[{Nu = 829440/(
     103680 - 8640 \[Epsilon]^2 + 3960 \[Epsilon]^4 + 
      297 \[Epsilon]^6 + 40 F^2 \[Epsilon]^6 \[Lambda]^2 + 
      40 F^2 \[Epsilon]^6 \[Lambda]^2 Cos[2 \[Beta]])},
   Nu (1 /4 (1 - r^2) + \[Epsilon] 1 /
       8 (r^3 - 
         r) Sin[\[Zeta]] + \[Epsilon]^2 (1 /
          24 Cos[2 \[Zeta]] (r^4 - r^2) + (r^2/16 - r^4/32 - 1/
           32)) + \[Epsilon]^3 1 /
       32 Sin[\[Zeta]] (r^5 - r^3) + \[Epsilon]^3 1/
       72 F \[Lambda] Cos[\[Beta]] Sin[
        2 \[Zeta]] (r^2 - r^4) + \[Epsilon]^3 1/
       64  Sin[3 \[Zeta]] (r^3 - r^5))];
Manipulate[
 ContourPlot[
  T[r, \[Zeta], 
    F, \[Epsilon]] /. {r -> Norm[{x, y}], \[Zeta] -> 
     ArcTan[x, y]}, {x, -1, 1}, {y, -1, 1},
  ContourLabels -> Automatic,
  ColorFunction -> "Rainbow",
  RegionFunction -> (Norm[{#, #2}] <= 1 &),
  Frame -> False,
  Axes -> True,
  Contours -> 30,
  ContourShading -> Automatic,
  ContourLabels -> True,
  PlotLegends -> Automatic
  ],

 {{F, 200, "Force ratio"}, 0, 1000, 10},
 {{\[Epsilon], 0.2, "curvature ratio"}, {0.1, 0.2, 0.3, 0.4, 0.5}}

 ]

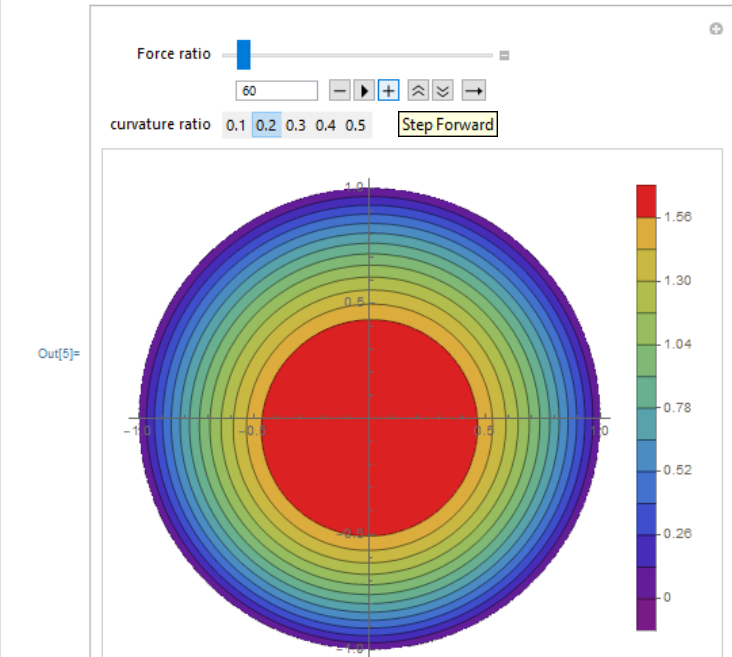
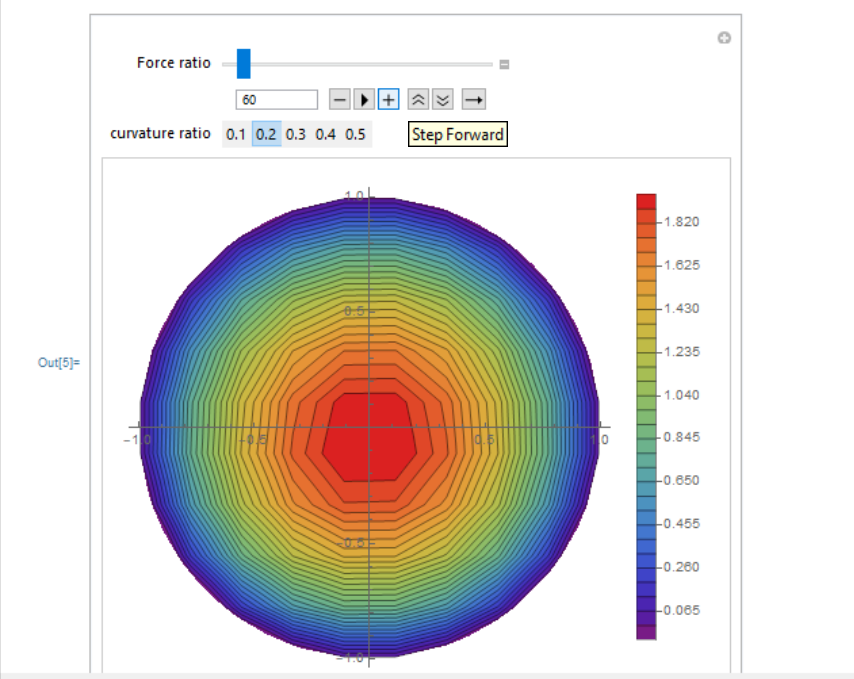
I want to show the smooth transition of the variable F. I found that it takes time to make load and smoothen the contour. I want to export the widget too in power point presentation. Please suggest? contour looks like enter image description here enter image description here
POSTED BY: KRISHAN SHARMA
5 Replies
Posted 2 years ago

I want to make a gif file of the plot. But the transition is not smooth Let me show you the example

man = Manipulate[ContourPlot[
    q1/Norm[{x, y} - p[[1]]] + q2/Norm[{x, y} - p[[2]]], {x, -2,
     2}, {y, -2, 2}, Contours -> 20, PlotRangePadding -> 0,
    Frame -> False, PlotPoints -> 40, ImageSize -> 230,
    ColorFunction -> "DarkRainbow"], {{q1, -1}, -3, 3}, {{q2, 2}, -3,
    3}, {{p, {{-1, 0}, {1, 0}}}, {-1, -1}, {1, 1}, Locator},
   Deployed -> True, FrameMargins -> 0];ManToGif[man, "charge", 2]

it shows very smooth transition of contour lines. The same i want in my case. I think mathematica is calculating the function every time and then showing the contour. Can't I save it for long step size as a gif or movie externally and operate.

POSTED BY: KRISHAN SHARMA
Posted 2 years ago

What is ManToGif?

POSTED BY: Rohit Namjoshi
Posted 2 years ago

In addition to Rohit's suggestion, I would add ContinuousAction -> False to the Manipulate so it only updates when you release on a new value and does not try to continuously update (which it really can't do well).

Regards,

Neil

POSTED BY: Neil Singer
Posted 2 years ago

Add the PerformanceGoal -> "Quality" option to ContourPlot. That will prevent a low-resolution version from being displayed while the high-resolution version is being computed.

POSTED BY: Rohit Namjoshi
Reply to this discussion
Community posts can be styled and formatted using the Markdown syntax.
Reply Preview
Attachments
Remove
or Discard

Group Abstract Group Abstract