I was trying to make a square wave function that represents the pixel clock of our instrument.
PixelClock[pixelTime_, gapTime_] :=
 Piecewise[{{1, Mod[#, pixelTime] < (pixelTime - gapTime)}}, 0] &
I would prefer it can produce a function that takes time quantity as input, for example:
pc1 = PixelClock[Quantity[20, "Microseconds"],
  Quantity[2, "Microseconds"]]
Running it with 1-100 microseconds as a list gives the expected answer.
pc1[Quantity[#, "Microseconds"]] & /@ Range[100]

Out[3]= {1, 1, 1, 1, 1, 1, 1, 1, 1, 1, 1, 1, 1, 1, 1, 1, 1, 0, 0, 1, \
1, 1, 1, 1, 1, 1, 1, 1, 1, 1, 1, 1, 1, 1, 1, 1, 1, 0, 0, 1, 1, 1, 1, \
1, 1, 1, 1, 1, 1, 1, 1, 1, 1, 1, 1, 1, 1, 0, 0, 1, 1, 1, 1, 1, 1, 1, \
1, 1, 1, 1, 1, 1, 1, 1, 1, 1, 1, 0, 0, 1, 1, 1, 1, 1, 1, 1, 1, 1, 1, \
1, 1, 1, 1, 1, 1, 1, 1, 0, 0, 1}
However, when I try to plot it, things get strange. 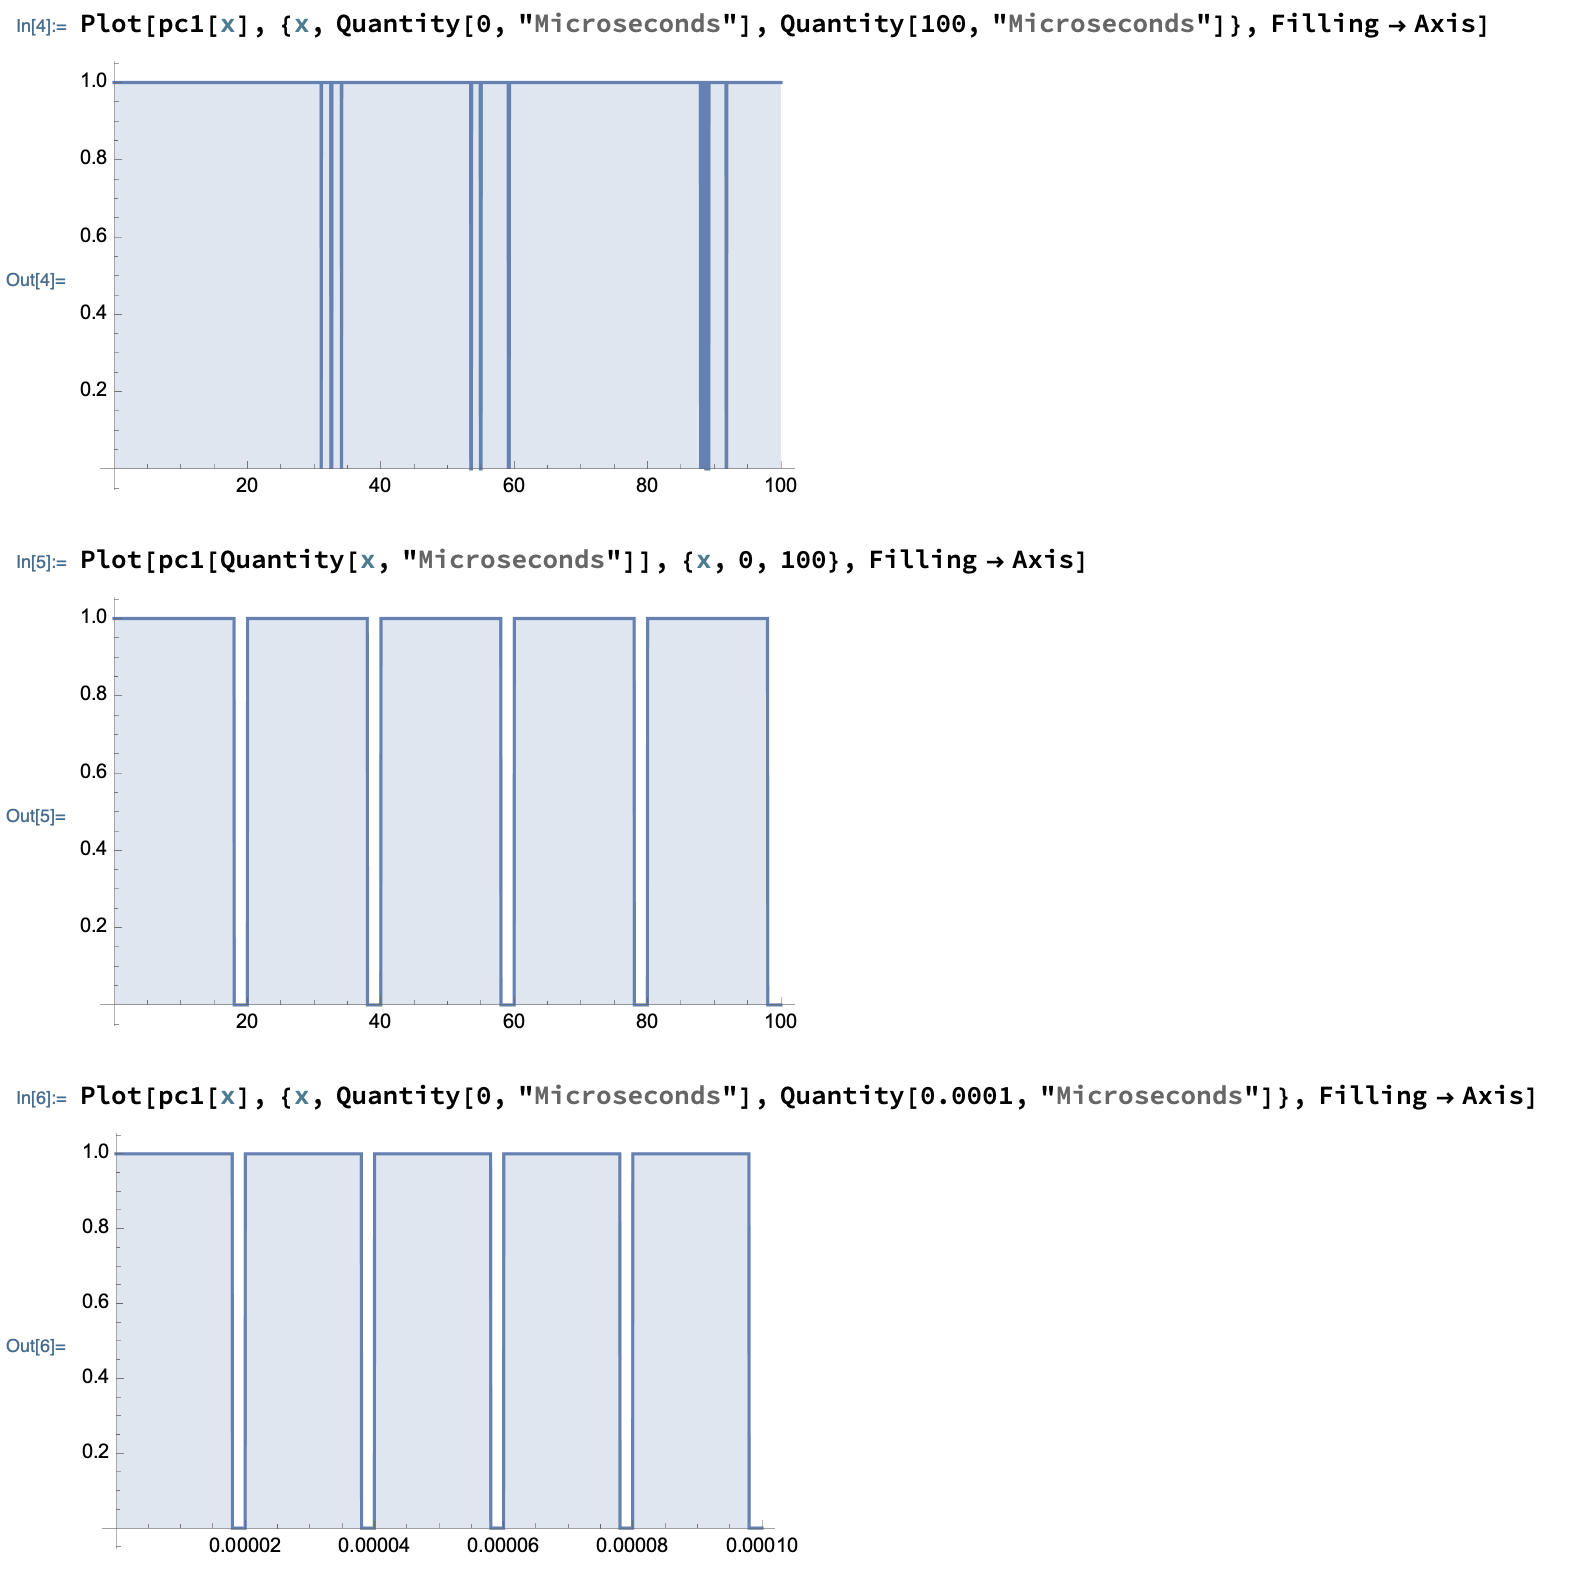
I would expect the first and the second plots to be equivalent. But they are not... I then realized if I reduce the value from 100 to 0.0001, the plot would look "correct" but is in fact using the wrong range. Is this a bug?


