The Parametric Plot of 2 NDSolve solutions do not show its results whenever I try to merge two plots into a single one. I've also tried using Show[a,b] and GraphicsOverlay[a,b] but the Show function does not graphs well and GraphicsOverlay function only shows only one of the graphs. What do I do to fix this?
NumericalDiffequaWithout1 =
  Table[NDSolve[{q[\[Phi]] + q''[\[Phi]] == -(0.02/(1 + q[\[Phi]]))^2,
      q[0] == 0.1*k, q'[0] == 0.1*k}, q, {\[Phi], 0, 50}], {k, 1, 5}];
NumericalDiffequaWith1 =
  Table[NDSolve[{q[\[Phi]] + q''[\[Phi]] == -(0.01/(1 + q[\[Phi]]))^2,
      q[0] == 0.1*k, q'[0] == 0.1*k}, q, {\[Phi], 0, 50}], {k, 1, 5}];

TestParametricPlotA =
 ParametricPlot[{{Evaluate[{q[\[Phi]], q'[\[Phi]]} /.
      NumericalDiffequaWith1]}}
  , {\[Phi], 0, 50}, AxesLabel -> {q[\[Phi]], \[Phi]},
  PlotRange -> All, PlotStyle -> Pink]
TestParametricPlotB =
 ParametricPlot[{{Evaluate[{q[\[Phi]], q'[\[Phi]]} /.
      NumericalDiffequaWithout1]}}
  , {\[Phi], 0, 50}, AxesLabel -> {q[\[Phi]], \[Phi]},
  PlotRange -> All, PlotStyle -> Purple]

TestParametricPlotC =
 ParametricPlot[{{Evaluate[{q[\[Phi]], q'[\[Phi]]} /.
      NumericalDiffequaWith1]}, {Evaluate[{q[\[Phi]], q'[\[Phi]]} /.
      NumericalDiffequaWithout1]}}
  , {\[Phi], 0, 50}, AxesLabel -> {q[\[Phi]], \[Phi]},
  PlotRange -> All]
Gives the results:
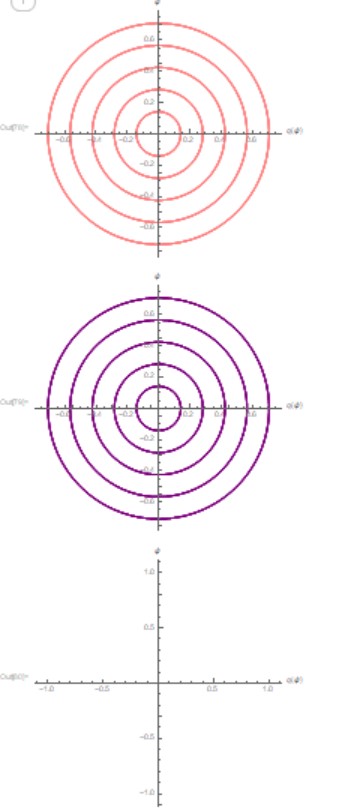
Where TestParametricPlotA and TestParametricPlotB works but combining them in TestParametricPlotC doesn't work.


