Message Boards Message Boards

0
|
4086 Views
|
5 Replies
|
3 Total Likes
View groups...
Share
Share this post:

How to find the dimensionless ListContourPlot?

Posted 2 years ago

Hello,

I am trying to plot a temperature contour using some data attached below (csv file column pattern "X" "Y" "T"). I want to find the non-dimensionalize temperature contour. T*=(T-Tw)/(Tm-Tw). Although I know Tm that it is the mean of all (x,y) points Temperature. But don't know how to take the Tw? Please Guide me.

Here

  • T= Temperature
  • Tw= Wall temperature
  • Tm= Mean temperature
  • T*= Dimensionless temperature

This one is Dimensional Temperature contour: enter image description here

ClearAll["Global`*"];
T = Import[
   "G:\\Comsol Simulation\\helical pipe\\Mathematica \
Plot\\temperature contour data.csv"];
ListContourPlot[
 T,
 Frame -> False,
 ContourShading -> Automatic,
 ColorFunction -> "Rainbow",
 PlotLegends -> Automatic,
 Axes -> False,
 Contours -> 30
 ]
Attachments:
POSTED BY: KRISHAN SHARMA
5 Replies
Posted 2 years ago

If I understand your question, you're stuck trying to figure out Wall Temperature. But I don't know what Wall Temperature is. Is that a term that is well-defined in some knowledge domain? Is it the average temperature at the boundary? The max? Min?

On the other hand you use the term "dimensionless temperature". What's that? I would have thought you just want something like QuantityMagnitude, but that doesn't seem to fit with the way you use the term.

Can you rephrase your question so that we know what you're trying to achieve without us having to understand the knowledge area you're working in? Can you make this a question about Mathematica specifically?

POSTED BY: Eric Rimbey

You can specify the style of the contours but if you do, you must generate a list for all of them:

Using the example in the List ContourPlot documentation:

clist = Function[{min, max}, 
    Join[Range[min, max/2, 0.1], {{max/2, {Red, Thick}}}, 
     Range[max/2 + 0.2, max, 0.1]]] @@ {-1, 1};

I tried to use this function as the argument in Contours but there appears to be a bug so I have to make the list separately. (No need for the function form here but maybe someone can figure out how to fix this function to work with Contours->...)
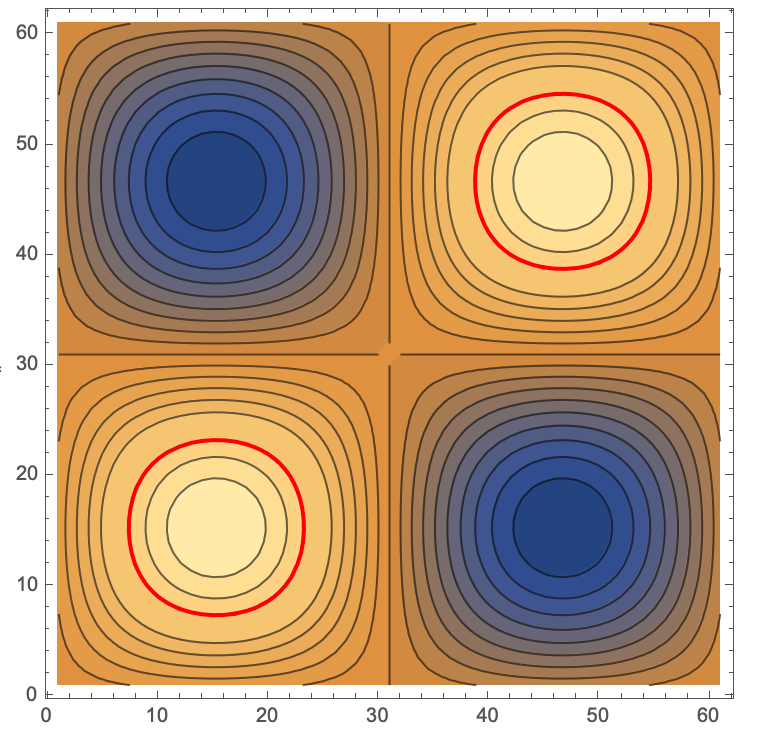
ListContourPlot[
 Table[Sin[x] Sin[y], {x, -3, 3, 0.1}, {y, -3, 3, 0.1}], 
 Contours -> clist]

to get

enter image description here

To find the min max range for your data you can do this first:

ListContourPlot[
  Table[Sin[x] Sin[y], {x, -3, 3, 0.1}, {y, -3, 3, 0.1}], 
  Contours -> 
   Function[{min, max}, ranges = {min, max}; Range[min, max, 0.1]]];

to define ranges to get the min and max of the data for computing a list of contours.

POSTED BY: Neil Singer
Posted 2 years ago

Thank you, I will try this.

POSTED BY: KRISHAN SHARMA
Posted 2 years ago

Sir, I have tried it but not getting anything. Can you elaborate how can i proceed to non-dimensionalize the temperature.

POSTED BY: KRISHAN SHARMA

Perhaps something along these lines will give you a direction to follow:

{tMin, tMax} = MinMax[ T[[All, 3]]]

T[[All, 3]] = (T[[All, 3]] - tMin) (tMax - tMin)

ListPlot3D[T, ColorFunction -> "TemperatureMap"]
ListContourPlot[T, PlotLegends -> True]
POSTED BY: W. Craig Carter
Reply to this discussion
Community posts can be styled and formatted using the Markdown syntax.
Reply Preview
Attachments
Remove
or Discard

Group Abstract Group Abstract