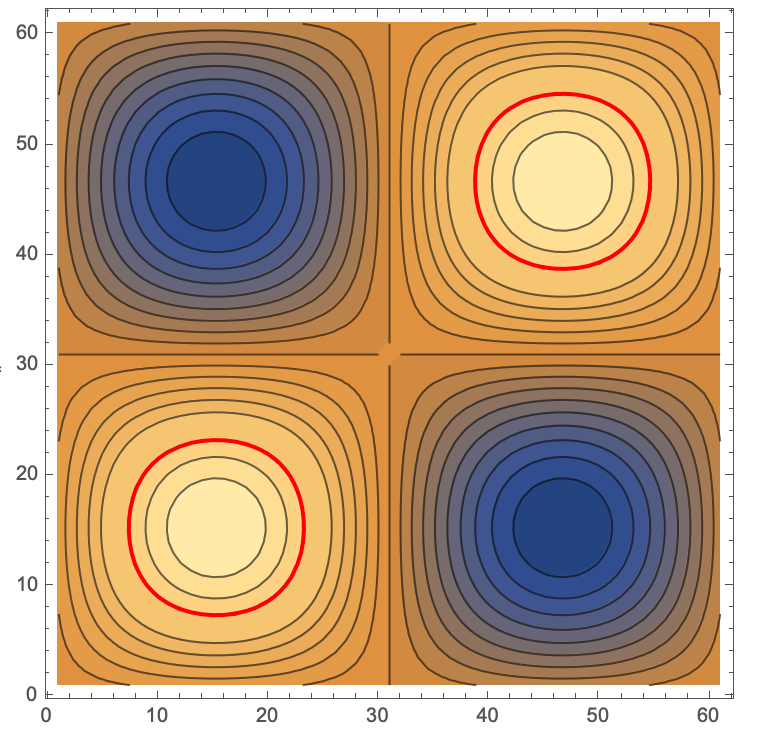
You can specify the style of the contours but if you do, you must generate a list for all of them:
Using the example in the List ContourPlot documentation:
clist = Function[{min, max},
    Join[Range[min, max/2, 0.1], {{max/2, {Red, Thick}}},
     Range[max/2 + 0.2, max, 0.1]]] @@ {-1, 1};
I tried to use this function as the argument in Contours but there appears to be a bug so I have to make the list separately. (No need for the function form here but maybe someone can figure out how to fix this function to work with Contours->...)
ListContourPlot[
 Table[Sin[x] Sin[y], {x, -3, 3, 0.1}, {y, -3, 3, 0.1}],
 Contours -> clist]
to get

To find the min max range for your data you can do this first:
ListContourPlot[
  Table[Sin[x] Sin[y], {x, -3, 3, 0.1}, {y, -3, 3, 0.1}],
  Contours ->
   Function[{min, max}, ranges = {min, max}; Range[min, max, 0.1]]];
to define ranges to get the min and max of the data for computing a list of contours.