Group Abstract Group Abstract

Message Boards Message Boards

0
|
6K Views
|
5 Replies
|
3 Total Likes
View groups...
Share
Share this post:

How to find the dimensionless ListContourPlot?

Posted 3 years ago

Hello,

I am trying to plot a temperature contour using some data attached below (csv file column pattern "X" "Y" "T"). I want to find the non-dimensionalize temperature contour. T*=(T-Tw)/(Tm-Tw). Although I know Tm that it is the mean of all (x,y) points Temperature. But don't know how to take the Tw? Please Guide me.

Here

  • T= Temperature
  • Tw= Wall temperature
  • Tm= Mean temperature
  • T*= Dimensionless temperature

This one is Dimensional Temperature contour: enter image description here

ClearAll["Global`*"];
T = Import[
   "G:\\Comsol Simulation\\helical pipe\\Mathematica \
Plot\\temperature contour data.csv"];
ListContourPlot[
 T,
 Frame -> False,
 ContourShading -> Automatic,
 ColorFunction -> "Rainbow",
 PlotLegends -> Automatic,
 Axes -> False,
 Contours -> 30
 ]
Attachments:
POSTED BY: KRISHAN SHARMA
5 Replies
Posted 3 years ago
POSTED BY: Eric Rimbey

You can specify the style of the contours but if you do, you must generate a list for all of them:

Using the example in the List ContourPlot documentation:

clist = Function[{min, max}, 
    Join[Range[min, max/2, 0.1], {{max/2, {Red, Thick}}}, 
     Range[max/2 + 0.2, max, 0.1]]] @@ {-1, 1};

I tried to use this function as the argument in Contours but there appears to be a bug so I have to make the list separately. (No need for the function form here but maybe someone can figure out how to fix this function to work with Contours->...)

ListContourPlot[
 Table[Sin[x] Sin[y], {x, -3, 3, 0.1}, {y, -3, 3, 0.1}], 
 Contours -> clist]

to get
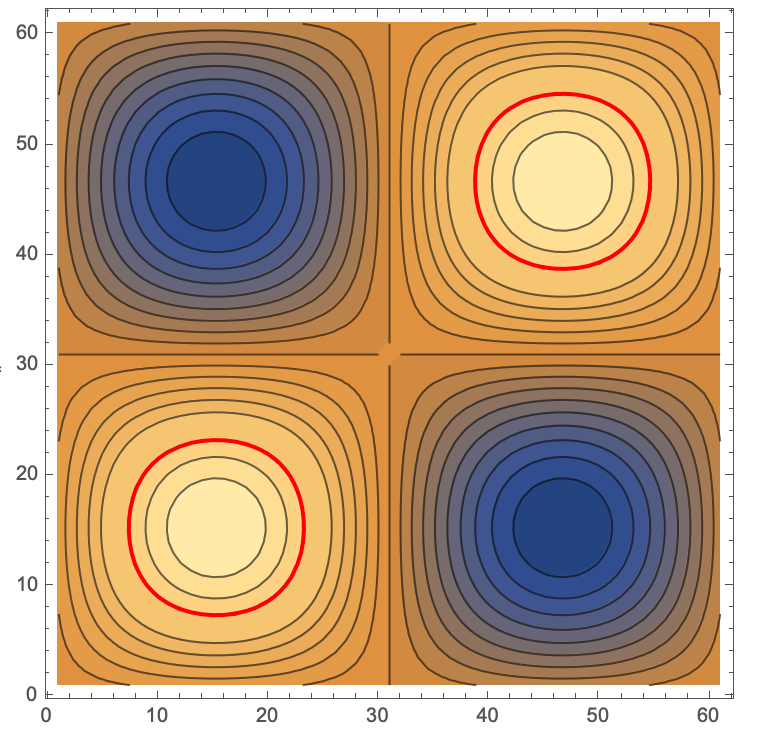
enter image description here

To find the min max range for your data you can do this first:

ListContourPlot[
  Table[Sin[x] Sin[y], {x, -3, 3, 0.1}, {y, -3, 3, 0.1}], 
  Contours -> 
   Function[{min, max}, ranges = {min, max}; Range[min, max, 0.1]]];

to define ranges to get the min and max of the data for computing a list of contours.

POSTED BY: Neil Singer
Posted 3 years ago

Thank you, I will try this.

POSTED BY: KRISHAN SHARMA
Posted 3 years ago

Sir, I have tried it but not getting anything. Can you elaborate how can i proceed to non-dimensionalize the temperature.

POSTED BY: KRISHAN SHARMA

Perhaps something along these lines will give you a direction to follow:

{tMin, tMax} = MinMax[ T[[All, 3]]]

T[[All, 3]] = (T[[All, 3]] - tMin) (tMax - tMin)

ListPlot3D[T, ColorFunction -> "TemperatureMap"]
ListContourPlot[T, PlotLegends -> True]
POSTED BY: W. Craig Carter
Reply to this discussion
Community posts can be styled and formatted using the Markdown syntax.
Reply Preview
Attachments
Remove
or Discard