Now I would like to plot the coordinates of the individual bodies.
For this you can use the function ParametricPlot (with the slightly modified code from above):
data = NBodySimulation[
"InverseSquare", {<|"Mass" -> 1, "Position" -> {0, 0},
"Velocity" -> {0, .5}|>, <|"Mass" -> 1, "Position" -> {1, 1},
"Velocity" -> {0, -.5}|>, <|"Mass" -> 1, "Position" -> {0, 1},
"Velocity" -> {0, 0}|>}, 4];
{xx, yy, zz} = data[All, "Position"];
{vxx, vyy, vzz} = data[All, "Velocity"];
{dvxx, dvyy, dvzz} = Derivative[1] /@ {vxx, vyy, vzz};
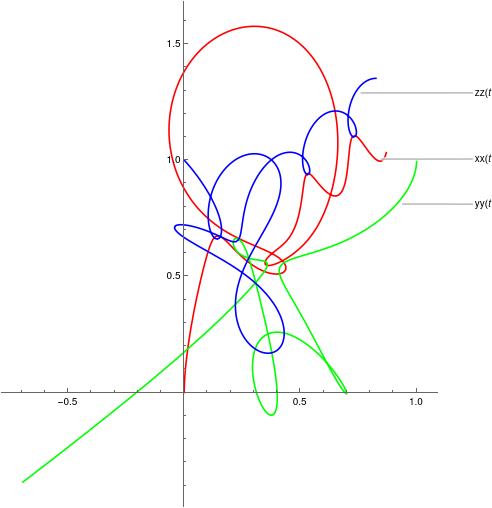
ParametricPlot[{xx[t], yy[t], zz[t]}, {t, 0, 4}, PlotStyle -> {Red, Green, Blue}, PlotLabels -> Automatic]
or likewise:
Manipulate[ParametricPlot[{xx[t], yy[t], zz[t]}, {t, 0, tt},
  PlotStyle -> {Red, Green, Blue}, PlotLabels -> Automatic,
  PerformanceGoal -> "Quality"], {tt, .1, 4}]


