You can use BSplineFunction to obtain points for your curve. For example:
C1 = {{-1.1690100430416068`, -0.31160297136810944`},
{-0.7472022955523672`, 0.22232503065839815`},
{-0.24505021520803427`, 0.8955385984309512`},
{0.2571018651362986`, 1.5455379052458302`},
{0.779340028694405`, 1.9866088634416408`},
{1.422094691535151`, 2.3580370387644285`},
{1.8840746054519375`, 2.4276798216374513`},
{2.1451936872309902`, 2.14910869014536`},
{2.1451936872309902`, 1.7544662538648983`},
{2.0648493543758972`, 1.243752512796065`},
{1.8238163558106173`, 0.8723243374732768`},
{1.3216642754662846`, 0.22232503065839815`},
{0.8797704447632717`, -0.4973170590295033`},
{0.23701578192252537`, -1.124102104886708`}};
f = BSplineFunction[C1, SplineDegree -> 10];
pts = Table[f[t], {t, 0, 1, 0.01}];
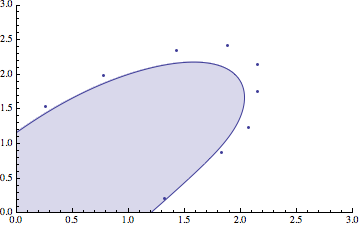
Show[ListLinePlot[pts, Filling -> Axis,
PlotRange -> {{0, 3}, {0, 3}}], ListPlot[C1]]
This is the same curve as you would obtain from using ListCurvePathPlot. I.e.
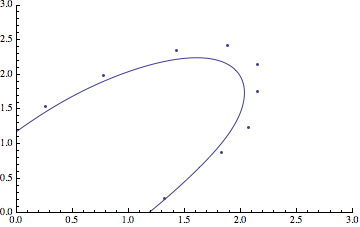
Show[curve = ListCurvePathPlot[C1, InterpolationOrder -> 10,
PlotRange -> {{0, 3}, {0, 3}}, AspectRatio -> 1/GoldenRatio],
ListPlot[C1]]
The reason they are the same is that the curve in ListCurvePathPlot is a BSplineCurve:
First@Cases[curve, _BSplineCurve, Infinity]
Output:
BSplineCurve[{{-0.747202, 0.222325}, ... , {-0.747202, 0.222325}},
SplineDegree -> 10]


