Message Boards Message Boards

0
|
4604 Views
|
5 Replies
|
2 Total Likes
View groups...
Share
Share this post:

ListCurvePathPlot [ ]

Posted 10 years ago
Hello,

I have a question,

I'm using ListCurvePathPlot [] for data stored in table C1, I mean:

ListCurvePathPlot[C1, InterpolationOrder -> 20]


 I have generated the graphic shown below.

However, I need to fill the region between curve and x axis. I have tried with Filling but this option doesn't matter for List CurvePathPlot.

Can you help me?

Thank you.
Attachments:
POSTED BY: Jorge Nisperuza
5 Replies
Posted 10 years ago
Hi Jorge,

If you want the curve to pass through every point in a smooth manner, then reducing the interpolation order is advisable. Using 20 allows a 20 degree polynomial; 2 or 3 is better. Using order 3 permits a 3rd degree polynomial which will allow for continuous 1st and 2nd derivatives, which is a pretty good definition of "smooth." But the fit is not allowed to go wild.

If what you want is a curve that is in some way a good fit to the data, without requiring it to pass through the points, you have a curve fitting problem. Chris's method is one way. The curve is "smooth" but as the points are control points the curve is not required to pass through the points. However, the form of the curve really has no meaning. If these data represent measurements of some phenomenum which can be modeled mathematically, it produces better insight to obtain the smooth curve as a best fit to some parameterized model. For this purpose, Mathematica has a rich set of fitting functions.

Best,
David
POSTED BY: David Keith
Posted 10 years ago
Thank You Chris,  your help was ok.
POSTED BY: Jorge Nisperuza
You can use BSplineFunction to obtain points for your curve.  For example:
 C1 = {{-1.1690100430416068`, -0.31160297136810944`},
    {-0.7472022955523672`, 0.22232503065839815`},
    {-0.24505021520803427`, 0.8955385984309512`},
    {0.2571018651362986`, 1.5455379052458302`},
    {0.779340028694405`, 1.9866088634416408`},
    {1.422094691535151`, 2.3580370387644285`},
    {1.8840746054519375`, 2.4276798216374513`},
    {2.1451936872309902`, 2.14910869014536`},
    {2.1451936872309902`, 1.7544662538648983`},
   {2.0648493543758972`, 1.243752512796065`},
   {1.8238163558106173`, 0.8723243374732768`},
   {1.3216642754662846`, 0.22232503065839815`},
   {0.8797704447632717`, -0.4973170590295033`},
   {0.23701578192252537`, -1.124102104886708`}};

f = BSplineFunction[C1, SplineDegree -> 10];

pts = Table[f[t], {t, 0, 1, 0.01}];

Show[ListLinePlot[pts, Filling -> Axis,
  PlotRange -> {{0, 3}, {0, 3}}], ListPlot[C1]]
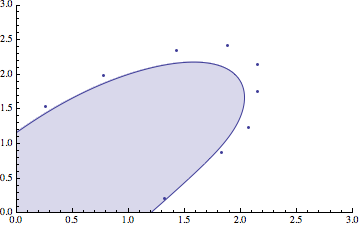

This is the same curve as you would obtain from using ListCurvePathPlot. I.e.
Show[curve = ListCurvePathPlot[C1, InterpolationOrder -> 10,
  PlotRange -> {{0, 3}, {0, 3}}, AspectRatio -> 1/GoldenRatio],
ListPlot[C1]]
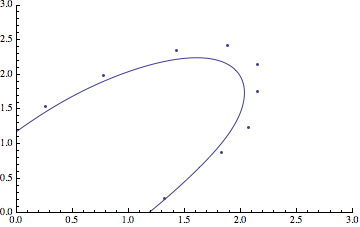

The reason they are the same is that the curve in ListCurvePathPlot is a BSplineCurve:
First@Cases[curve, _BSplineCurve, Infinity]
Output:
BSplineCurve[{{-0.747202, 0.222325}, ... , {-0.747202, 0.222325}},
SplineDegree -> 10]
POSTED BY: Chris Degnen
Posted 10 years ago
Thank you David but when I used ListLinePLot the contour isn't soft notwithstanding I use InterPolationOrder->20. With List LinePlot I can fill region inside of line but this line isn't  soft. 
POSTED BY: Jorge Nisperuza
Posted 10 years ago
Perhaps you could use FindCurvePath to sort the data, and then use ListLinePlot to plot the ordered list. But I am not sure what you mean by filling to the x axis, in that the curve is not single valued as y(x). Just using Filling->Axis will tend to fill the region between the curves. Breaking the curve into two segments, each single valued as y(x), could fill to to the axis from the top curve by plotting it separately.
POSTED BY: David Keith
Reply to this discussion
Community posts can be styled and formatted using the Markdown syntax.
Reply Preview
Attachments
Remove
or Discard

Group Abstract Group Abstract