We know how to align two plots as explained here, but what can we do if one of the plots has a different aspect ratio?
padding = {{30, 30}, {30, 30}};
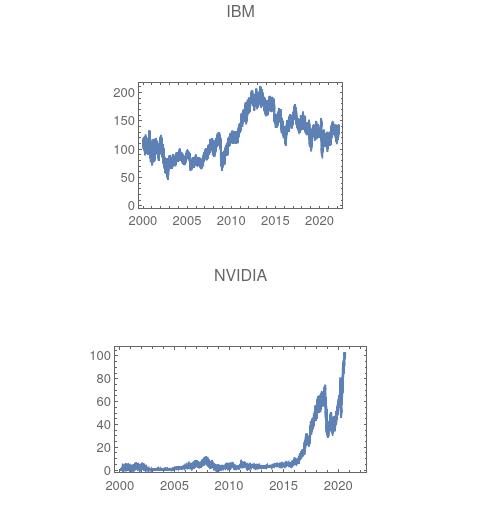
p1 = DateListPlot[FinancialData["IBM", "Jan. 1, 2000"],
PlotLabel -> "IBM", ImagePadding -> padding];
p2 = DateListPlot[FinancialData["NVDA", "Jan. 1, 2000"],
PlotLabel -> "NVIDIA", AspectRatio -> 1/2, ImagePadding -> padding];
GraphicsGrid[{{p1}, {p2}}]
The p2 plot now has an aspect ratio on 1/2 and as you can see the plots are no more aligned, i tried to play with different padding values for the two plot but i could not find a consistent solution. Any idea?