Hello, The problem I am having is this: I have a transfer function
TFalpha1 =
  TransferFunctionModel[{{{
     1.7607354217407793`*^7 + 15432.18944717527 s}},
    1.9007939847037688`*^7 + 17800.70861749659 s + 1. s^2}, s];
I can find out my magnitude plot with
P1 = LogLinearPlot[Abs[TFalpha1[I f]], {f, 0, 10^5},
  PlotStyle -> Directive[Green, Thick],
  AxesLabel -> {"\[Omega] (radian)", "Gain"},
  LabelStyle -> Directive[Black, Bold], PlotRange -> All,
  AxesOrigin -> {0, 0}, GridLines -> Automatic , Frame -> True]
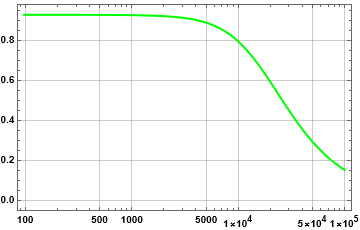
So that gives me

Here I am using my linear scale for the Gain axis. Now using
Now, using Abs[TFalpha1[I 22800][[1, 1]]] I can find out the Gain at f = 22800. But I want to find out at which f my gain is 0.54 (say). I know that I can use Get coordinate on the plot but it is really difficult to put the cursor with sufficient accuracy, especially if there are several such scenarios I need to explore. Is there a way to extract the frequency using a command? Your help will be very much appreciated. Regards, Koushik