How do I individually color each points in the Discrete Plot in order to make it similar like the one that I use in the Legend?
R[r_] := 2/(5*3)*1/(2*3)!*((2*r)/(5*3))^(2*3)*E^((-2*r)/(5*3))
SampleInitialConditions = N[Table[R[r], {r, 7, 105, 7}]];
SampleInitialConditionsScientific =
    SampleInitialConditions /. x_?NumberQ -> ScientificForm[x, 3];
ColorList = {Table[{Blend[{Blue, Green, Yellow, Red, Brown},
       InitialCond]}, {InitialCond,
            1/Length[SampleInitialConditions], 1,
      1/Length[SampleInitialConditions]}]} // Flatten;
LabelString =
  Table[StringForm["\[NumberSign] ``", LS], {LS, 1,
    Length[SampleInitialConditions]}];
LegendInitialConditions =
    SwatchLegend[ColorList, LabelString,
      LegendLabel -> "Initial Conditions", LegendFunction -> "Frame",
      LegendLayout -> "Row"];
DiscretePlot[
 Callout[SampleInitialConditions[[InitialCond]],
  StringForm["q[0] & q'[0] = \n ``",
   SampleInitialConditionsScientific[[InitialCond]]], Above,
  Background -> LightGray], {InitialCond, 1,
  Length[SampleInitialConditions]},
 PlotLabel -> "Table of Sample Initial Conditions", ImageSize -> 900,
 PlotTheme -> "Web", PlotLegends -> LegendInitialConditions,
 PlotStyle -> ColorList]
The code produces something like this:
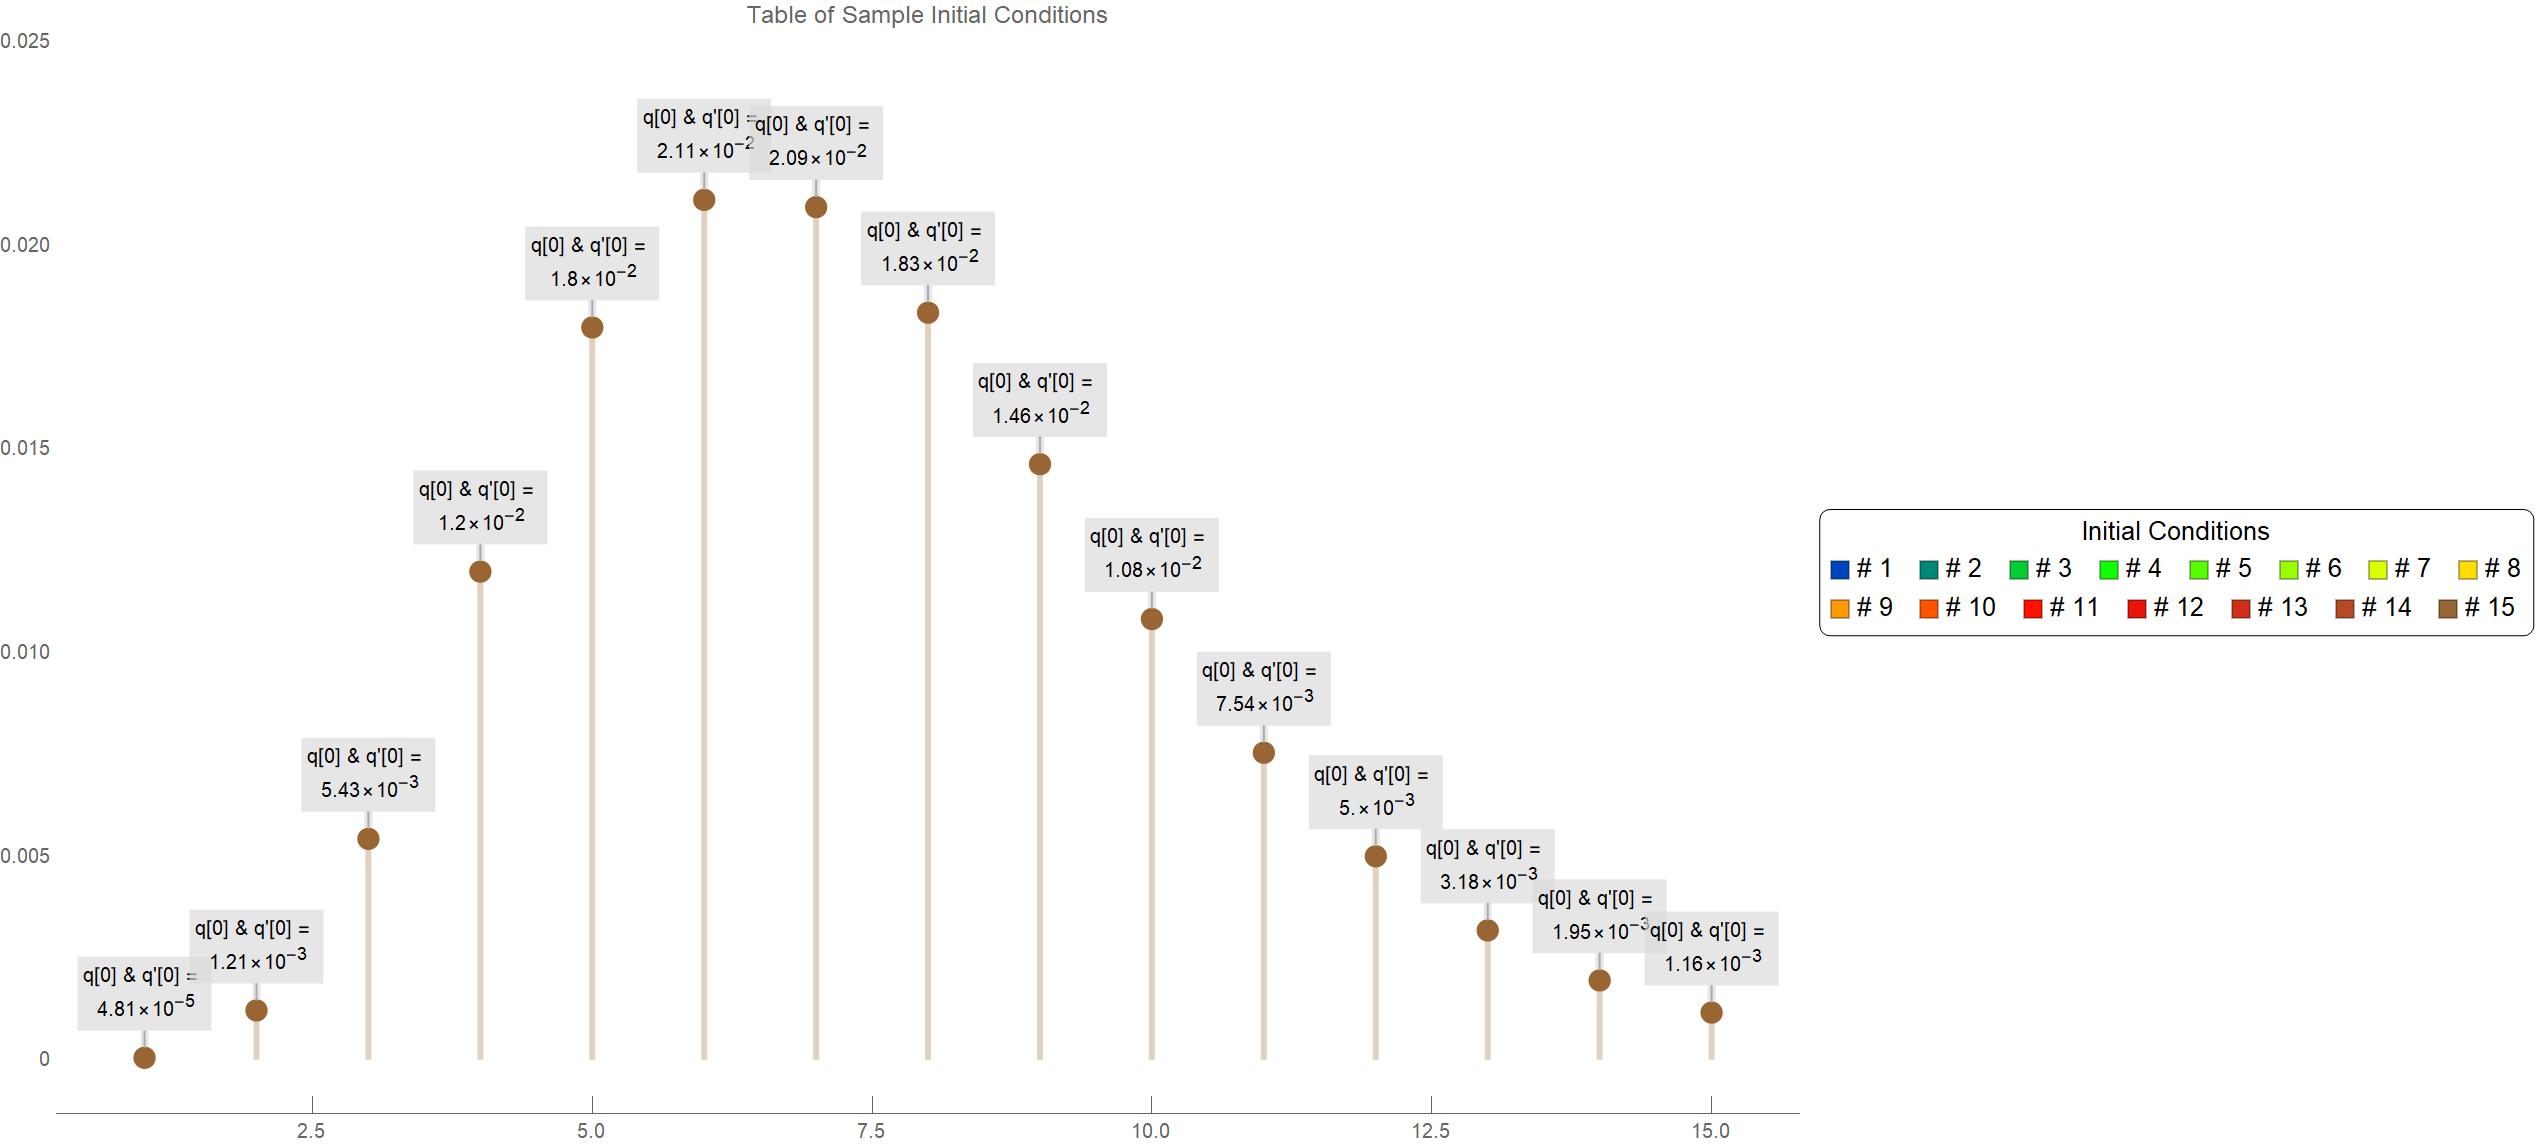
How do I match the color of the Legend with point #1 being colored blue and point #15 being colored brown? ColorFunction usually colors the points vertically and not horizontally.


