When I was in New York City I got a few nice GPS data records from my biking and walking trips. I used iPhone and some standard apps that can export GPX files. I'd like to show how to use the new WL functionality to visualize some of these data. I will import my .GPX file of a closed closed path - there a few other ways I will show later. You can also
download this trip around Silver Lake on Staten Isalnd.
data = Import["http://wolfr.am/1jkafLe", "Data"];
It is easy to get latitude and longitude of waypoints via Cases:
path = Cases[data, {_, _}, Infinity]
because this is the only data type inside consisting of pairs of numbers. Now let's display this on the map:
GeoGraphics[{Red, Thick, GeoPath[path]}, ImageSize -> 800]
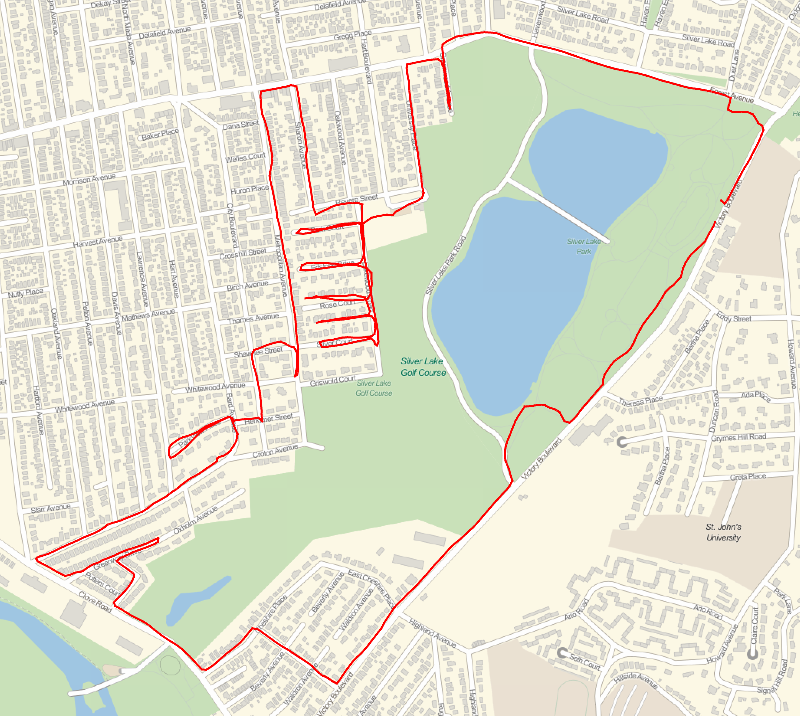
Now let's see if I wandered out of my favorite neighborhood on Staten Island:
GeoGraphics[{
{Red, Thick, GeoPath[bike]},
Polygon[Entity["Neighborhood", "SilverLake::NewYork::NewYork::UnitedStates"]]}]
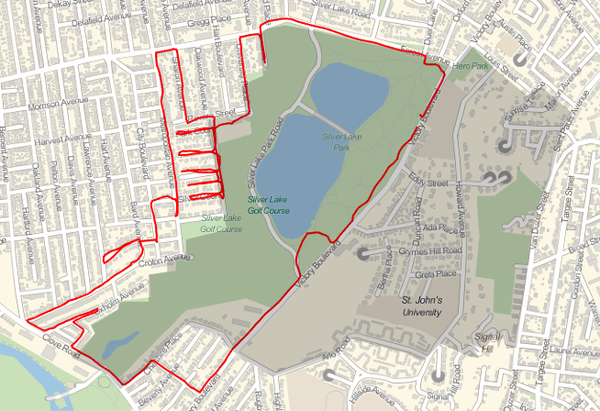
- and yes I did. Now lets plot the elevation during the trip:
elevation = Flatten[Import["http://wolfr.am/1jkafLe", {"Data", 1, "LabeledData", "PointElevation"}]];
times = Flatten[Import["http://wolfr.am/1jkafLe", {"Data", 1, "LabeledData", "PointTimestamp"}], 2];
eltise = TimeSeries[elevation, {times}]
DateListPlot[eltise, Filling -> Bottom, AspectRatio -> 1/7]
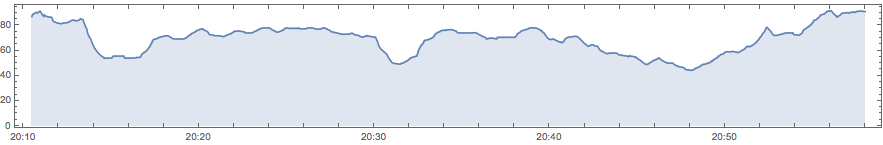
Note, this time I used different syntax to import data. Also note horizontal axis - trip was about 50 minutes in the evening. Now let's prove that with up to GPS data precision uphill and downhill elevations are about the same:
Select[Differences[eltise], # < 0 &] // Total
Select[Differences[eltise], # > 0 &] // Total
Out[173]= -164.
Out[174]= 168.


