I want to create an app in Mathematica that is similar to this gui, which is built in GeoGebra.
In this link, the user drags the point z around and he can visualize the point f(z)=exp(z) and the different vectors that contribute to its definition as a power series.
What I have now is the following:
ComplexExpand@ReIm@
  ReplaceAll[z -> \[Xi] + I \[Psi]][
   Accumulate[
    List @@ Normal@Series[Exp[z], {z, 0, 3}]
    ]
   ]
I then wrap the output of this input line in Arrow after manipulating this list appropriately in order for the vectors to follow one another, and give numerical values to ξ and ψ.
*I have done that today; I am not uploading the complete code here in order to keep the thread less cluttered.
Now I want the user to be able to move the point z around.
Please consider the following:
DynamicModule[{z = {1, 2}},
 GraphicsRow[{
   Framed@Graphics[Locator[Dynamic[z]], PlotRange -> 3]
   ,
   Framed@Graphics[Locator[Dynamic[E^z]], PlotRange -> Exp[3]]
   }
  ]
 ]

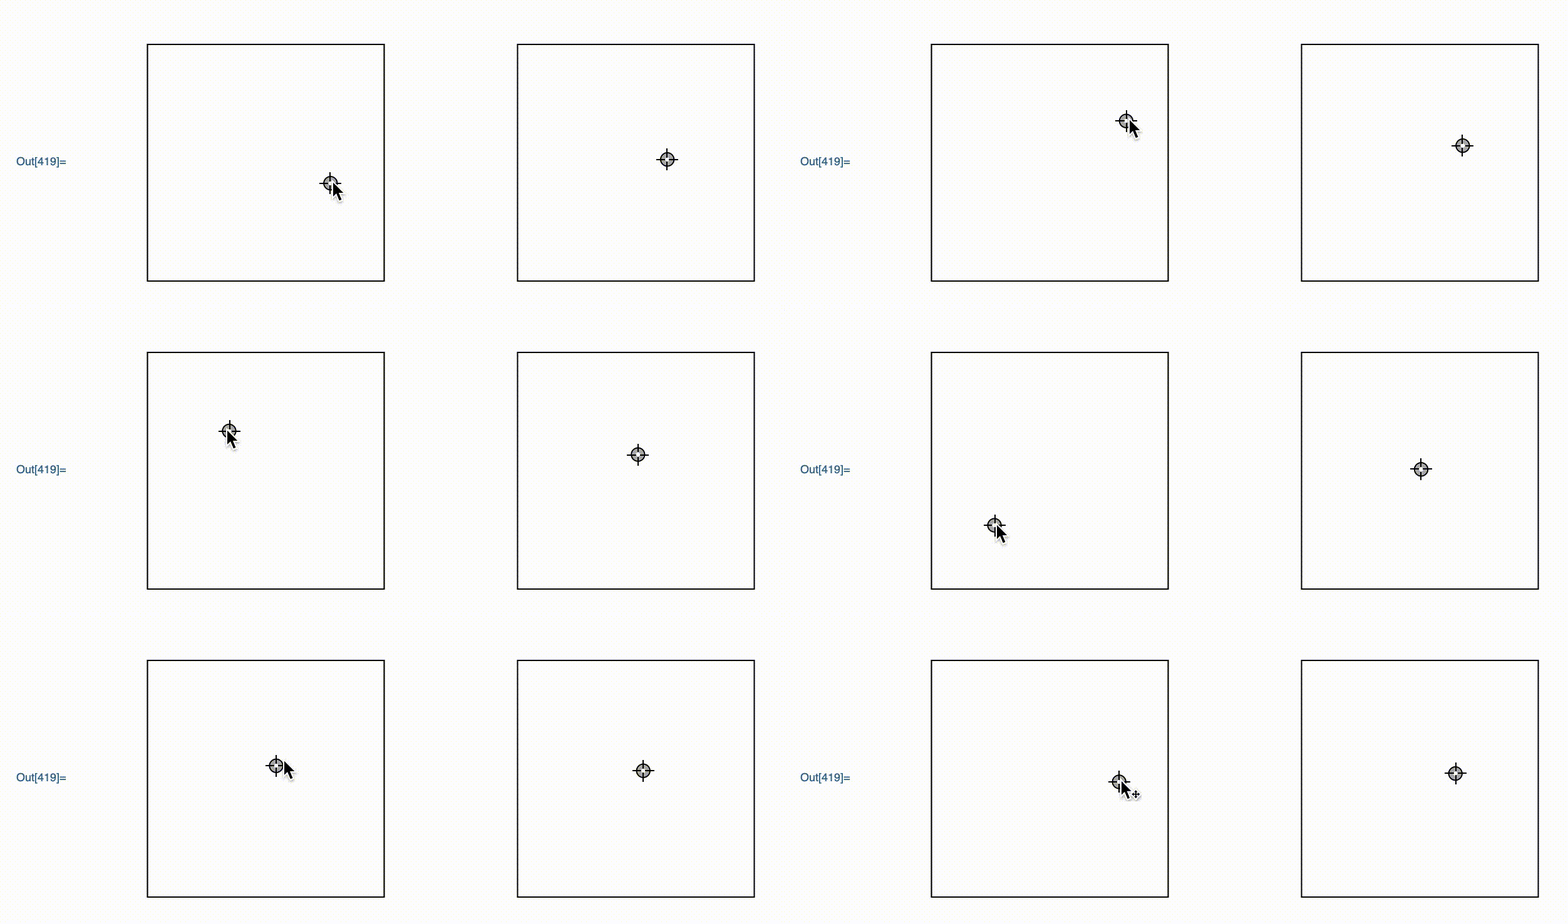
This is a graphics object that I wrote. It allows the user to move around the point in the left hand graphics, with the right one moving accordingly.
In order to implement the same idea into the first code snippet I mentioned, I need to wrap each occurrence of ξ and ψ with Dynamic. For example,
{1 + ξ + ξ^2/2 - ψ^2/2, ψ + ξ ψ}
which is the third list element in the power series, should be turned into
{1 + Dynamic[ξ] + Dynamic[ξ]^2/2 - Dynamic[ψ]^2/2, Dynamic[ψ] + Dynamic[ξ] Dynamic[ψ]}
My question is if this is really the correct way to construct an interactive model as the one I describe here?
Wrap some ~100 symbols (the ξs and ψs) with Dynamic[]?
If the answer is No, can someone tell me the more correct way?
If the answer is Yes, what WL function does such a thing as applying the function Dynamic to each occurrence of ξs and ψ?
Thanks very much!