Signal processing from Discrete data (DFT)
I am new one to Mathematica. So excuse me if my question is not absolutely accurate. I am trying to find all isolated frequencies in Fourier domain. And then to make inverse Fourier. And finally to find the Stokes parameters. I tried numerous methods to obtain the results from the second picture (see below), but I have not succeeded. Also I think that the FourierParameters -> {a, b} must also be part of the focus in order to have an accurate frequency propagation in the Fourier domain. The second picture was made with programs write in Fortran, which are very complicated.
The first picture is the spectrum in Time domain: 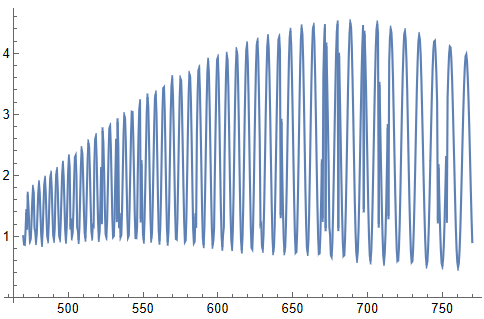
The second picture are what I want to find first, e.g. frequencies amplitudes in Fourier domain: 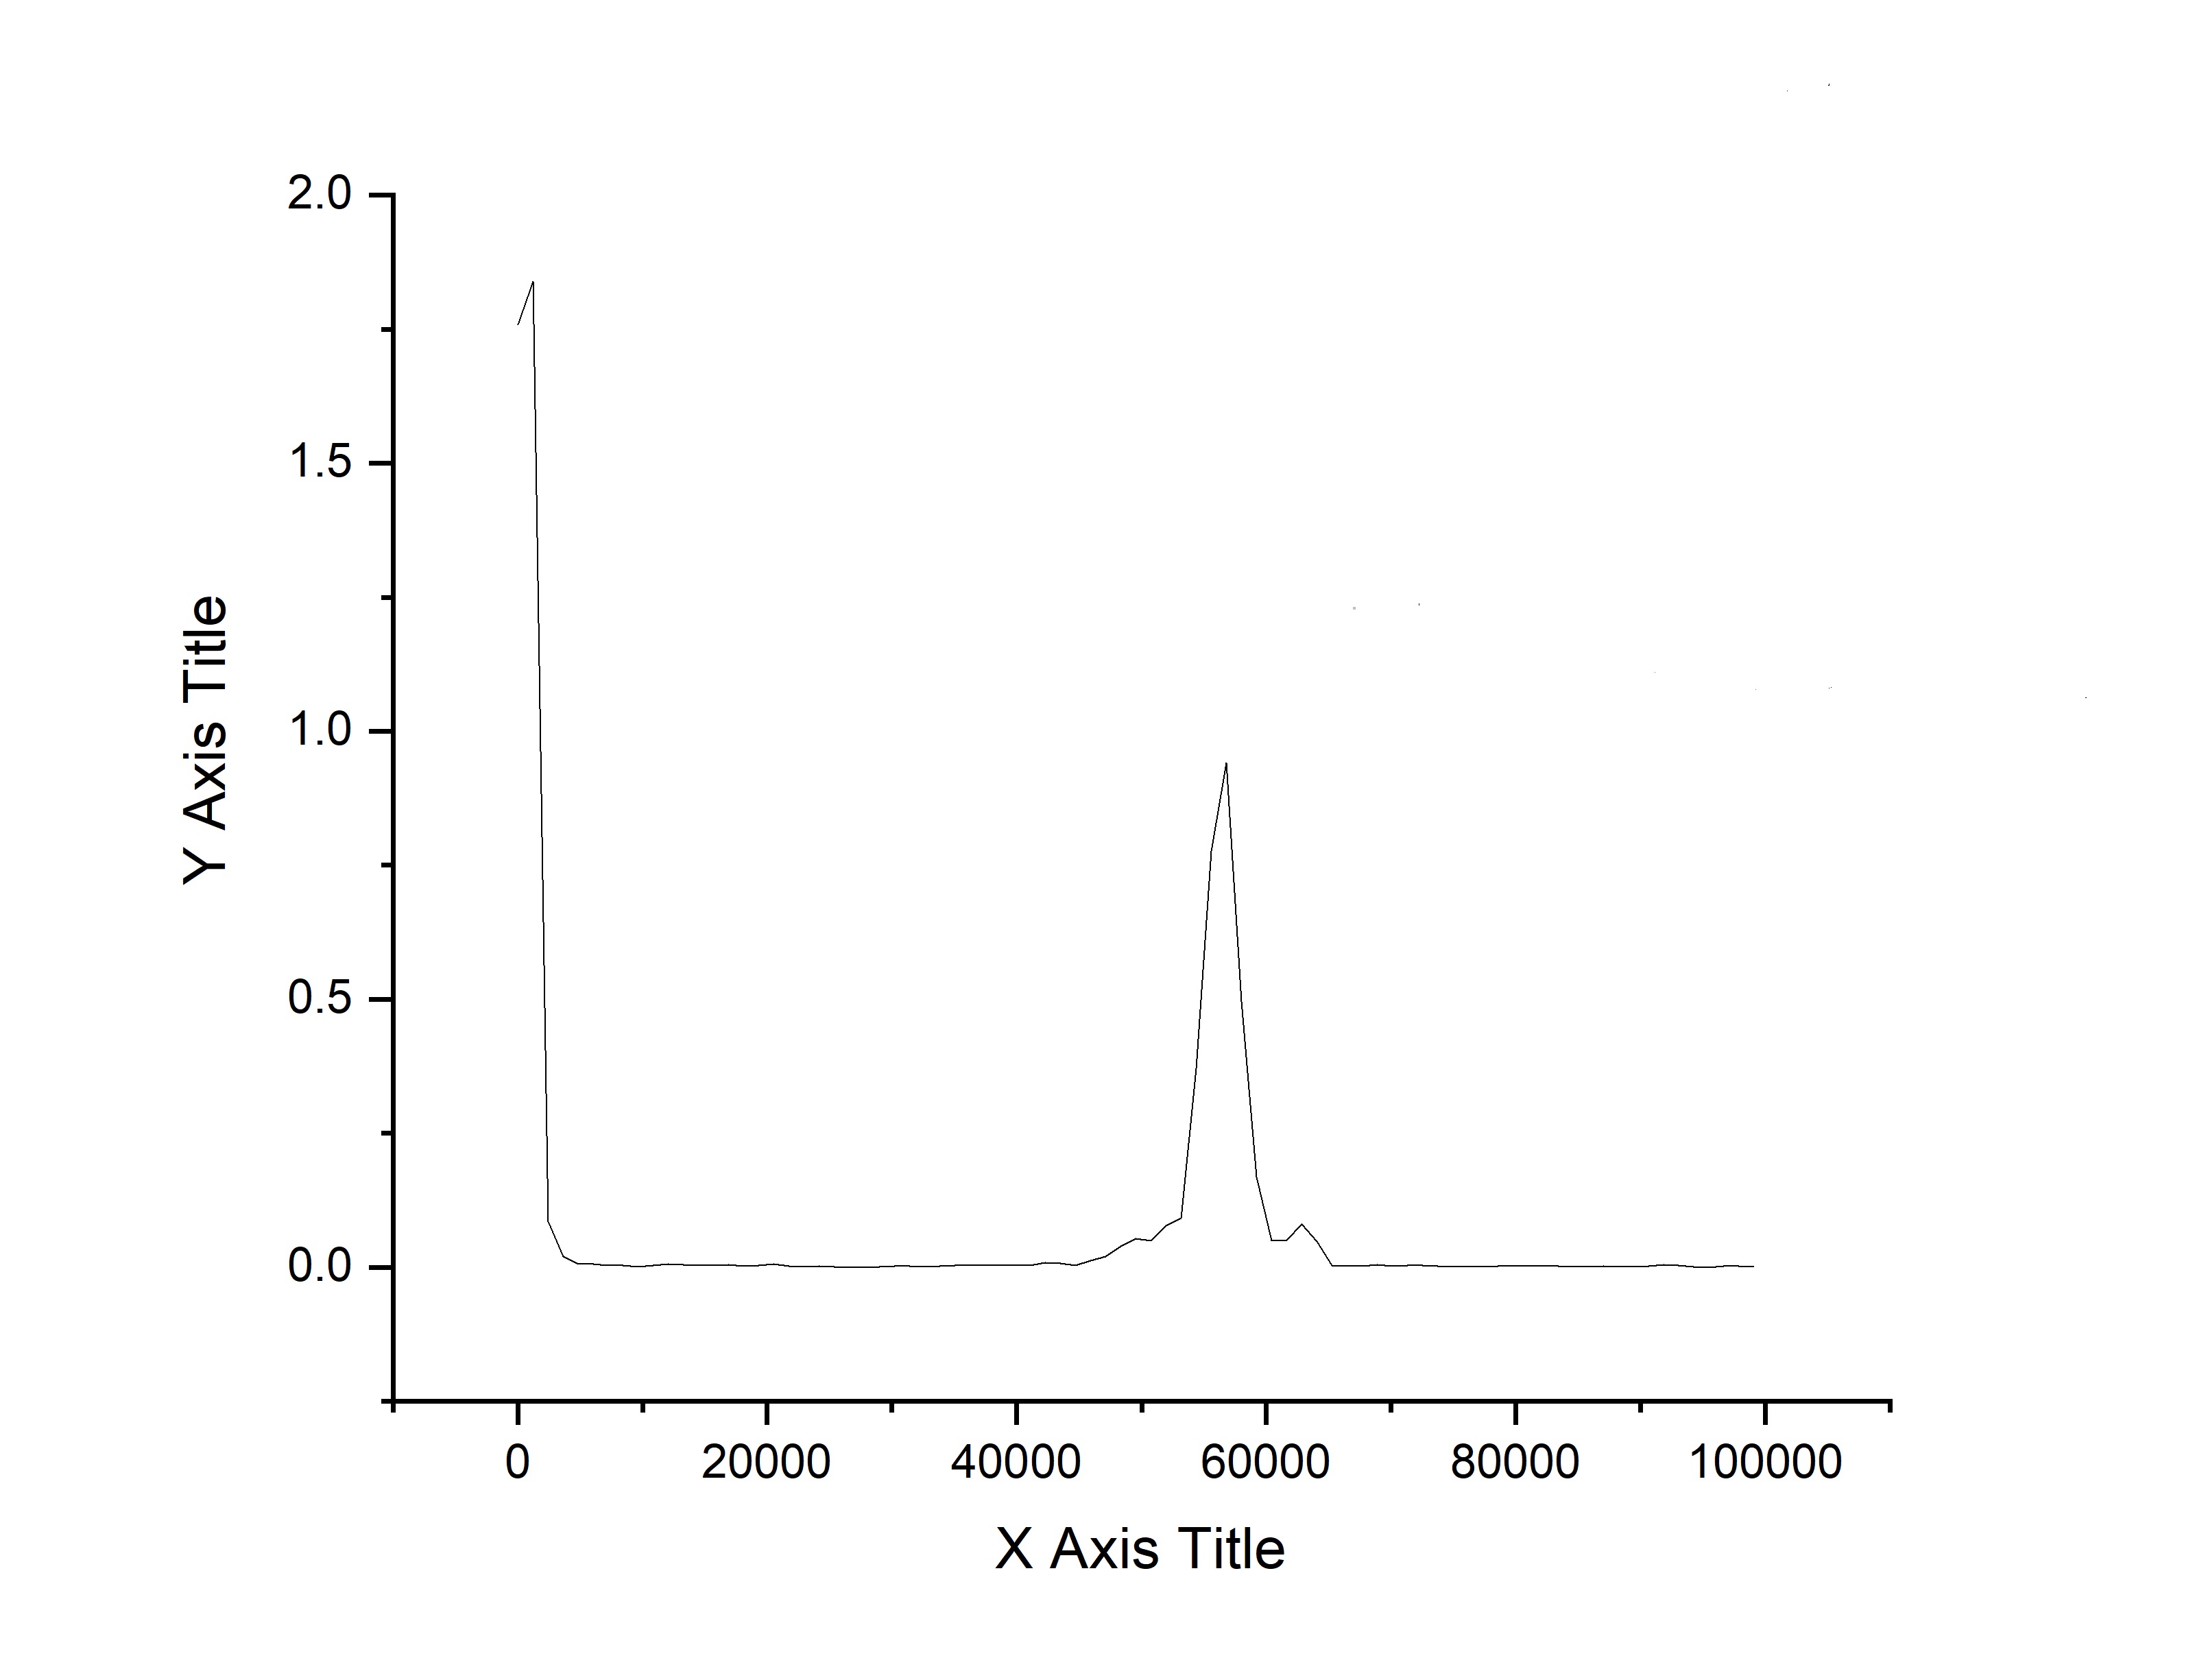
My code is:
data={{470, 1.00111}, {470.5, 0.865657}, {471, 0.861368}, {471.5,
  1.07667}, {472, 1.38733}, {472.5, 1.16407}, {473, 1.67352}, {473.5,
  1.47189}, {474, 1.153}, {474.5, 0.920997}, {475, 0.959242}, {475.5,
  1.23009}, {476, 1.57159}, {476.5, 1.78719}, {477, 1.71385}, {477.5,
  1.13948}, {478, 1.07257}, {478.5, 0.912846}, {479, 1.03221}, {479.5,
   1.37547}, {480, 1.71106}, {480.5, 1.85964}, {481, 1.71868}, {481.5,
   1.35451}, {482, 1.02001}, {482.5, 0.883209}, {483,
  1.10228}, {483.5, 1.494}, {484, 1.83777}, {484.5, 1.93559}, {485,
  1.71848}, {485.5, 1.33224}, {486, 1.00428}, {486.5, 0.942281}, {487,
   1.18941}, {487.5, 1.61404}, {488, 1.95829}, {488.5, 2.01875}, {489,
   1.78422}, {489.5, 1.37866}, {490, 1.01811}, {490.5,
  0.950172}, {491, 1.12167}, {491.5, 1.65207}, {492, 2.01279}, {492.5,
   2.08002}, {493, 1.80443}, {493.5, 1.35575}, {494, 1.00595}, {494.5,
   0.958044}, {495, 1.20946}, {495.5, 1.63308}, {496,
  2.02572}, {496.5, 2.18136}, {497, 1.97009}, {497.5, 1.54594}, {498,
  1.10425}, {498.5, 0.937348}, {499, 1.13739}, {499.5, 1.59983}, {500,
   2.06104}, {500.5, 2.28579}, {501, 2.12739}, {501.5, 1.16975}, {502,
   1.23612}, {502.5, 0.990508}, {503, 1.05977}, {503.5,
  1.41821}, {504, 1.92937}, {504.5, 2.29586}, {505, 2.32385}, {505.5,
  1.99891}, {506, 1.14999}, {506.5, 1.09411}, {507, 0.931286}, {507.5,
   1.13962}, {508, 1.64753}, {508.5, 2.14241}, {509, 2.42155}, {509.5,
   2.35213}, {510, 1.96724}, {510.5, 1.44279}, {511, 1.06286}, {511.5,
   0.96913}, {512, 1.24272}, {512.5, 1.75849}, {513, 2.25342}, {513.5,
   2.53026}, {514, 2.45916}, {514.5, 2.07152}, {515, 1.54018}, {515.5,
   1.09093}, {516, 0.987241}, {516.5, 1.18045}, {517,
  1.16735}, {517.5, 2.20644}, {518, 2.58158}, {518.5, 2.63565}, {519,
  2.29055}, {519.5, 1.73987}, {520, 1.22088}, {520.5, 0.966176}, {521,
   1.07755}, {521.5, 1.49291}, {522, 2.07988}, {522.5, 1.25521}, {523,
   2.72784}, {523.5, 2.54214}, {524, 2.06504}, {524.5, 1.46094}, {525,
   1.03954}, {525.5, 0.989282}, {526, 1.24566}, {526.5,
  1.76289}, {527, 2.35963}, {527.5, 2.76917}, {528, 2.80547}, {528.5,
  2.47985}, {529, 1.90736}, {529.5, 1.31674}, {530, 0.98921}, {530.5,
  1.0043}, {531, 1.36859}, {531.5, 1.94213}, {532, 2.54229}, {532.5,
  1.28949}, {533, 2.87538}, {533.5, 2.45989}, {534, 1.18886}, {534.5,
  1.32463}, {535, 0.989034}, {535.5, 1.02239}, {536, 1.42476}, {536.5,
   2.0598}, {537, 2.65826}, {537.5, 2.97926}, {538, 2.93115}, {538.5,
  2.54592}, {539, 1.91331}, {539.5, 1.32766}, {540, 0.98311}, {540.5,
  1.0162}, {541, 1.43381}, {541.5, 2.05239}, {542, 2.67653}, {542.5,
  3.04146}, {543, 3.03634}, {543.5, 2.62887}, {544, 1.99725}, {544.5,
  1.35244}, {545, 0.971386}, {545.5, 0.970432}, {546,
  1.13686}, {546.5, 2.0096}, {547, 2.65322}, {547.5, 3.08193}, {548,
  3.18869}, {548.5, 1.28455}, {549, 2.19291}, {549.5, 1.51018}, {550,
  1.03551}, {550.5, 0.937229}, {551, 1.24873}, {551.5, 1.78522}, {552,
   2.43602}, {552.5, 3.02302}, {553, 3.28276}, {553.5, 3.12629}, {554,
   2.60494}, {554.5, 1.90346}, {555, 1.30054}, {555.5,
  0.954202}, {556, 1.0563}, {556.5, 1.52043}, {557, 2.19149}, {557.5,
  2.83768}, {558, 3.27424}, {558.5, 3.33244}, {559, 2.99914}, {559.5,
  2.33637}, {560, 1.61778}, {560.5, 1.09978}, {561, 0.919303}, {561.5,
   1.12371}, {562, 1.63161}, {562.5, 2.36995}, {563, 3.04296}, {563.5,
   3.42709}, {564, 3.44235}, {564.5, 3.06566}, {565, 2.40045}, {565.5,
   1.66966}, {566, 1.12292}, {566.5, 0.902694}, {567,
  1.06914}, {567.5, 1.54812}, {568, 2.29338}, {568.5, 3.00195}, {569,
  3.45222}, {569.5, 3.58287}, {570, 3.31878}, {570.5, 2.74894}, {571,
  2.02756}, {571.5, 1.36664}, {572, 0.956309}, {572.5,
  0.947904}, {573, 1.30423}, {573.5, 1.93491}, {574, 2.659}, {574.5,
  3.26295}, {575, 3.58456}, {575.5, 3.54861}, {576, 3.15525}, {576.5,
  2.51271}, {577, 1.82443}, {577.5, 1.24361}, {578, 0.910831}, {578.5,
   0.934569}, {579, 1.32377}, {579.5, 2.00162}, {580,
  2.72304}, {580.5, 3.32511}, {581, 3.65543}, {581.5, 3.61048}, {582,
  3.22493}, {582.5, 2.58533}, {583, 1.83516}, {583.5, 1.12155}, {584,
  0.890239}, {584.5, 0.914079}, {585, 1.32013}, {585.5,
  1.19545}, {586, 2.69194}, {586.5, 3.33694}, {587, 3.71723}, {587.5,
  3.75723}, {588, 3.40869}, {588.5, 2.81017}, {589, 2.11651}, {589.5,
  1.40393}, {590, 0.964168}, {590.5, 0.862898}, {591, 1.1414}, {591.5,
   1.72307}, {592, 2.44454}, {592.5, 3.16078}, {593, 3.69392}, {593.5,
   3.86919}, {594, 3.69411}, {594.5, 3.15774}, {595, 2.45382}, {595.5,
   1.72085}, {596, 1.13103}, {596.5, 0.853184}, {597,
  0.930437}, {597.5, 1.13774}, {598, 2.03242}, {598.5, 2.80077}, {599,
   3.47452}, {599.5, 3.89001}, {600, 3.92779}, {600.5, 3.59214}, {601,
   2.96499}, {601.5, 2.19861}, {602, 1.48595}, {602.5, 1.00215}, {603,
   0.82109}, {603.5, 1.03237}, {604, 1.15585}, {604.5, 2.31359}, {605,
   3.07879}, {605.5, 3.68425}, {606, 3.96619}, {606.5, 3.88958}, {607,
   3.46157}, {607.5, 2.78308}, {608, 2.03354}, {608.5, 1.36794}, {609,
   0.935997}, {609.5, 0.816046}, {610, 1.08448}, {610.5,
  1.67036}, {611, 2.42397}, {611.5, 3.18064}, {612, 3.75861}, {612.5,
  4.04331}, {613, 3.98065}, {613.5, 3.56974}, {614, 2.90321}, {614.5,
  2.10028}, {615, 1.39804}, {615.5, 0.93042}, {616, 0.775687}, {616.5,
   0.991312}, {617, 1.52474}, {617.5, 2.25763}, {618,
  3.02556}, {618.5, 3.65101}, {619, 4.05309}, {619.5, 4.13664}, {620,
  3.86664}, {620.5, 3.31419}, {621, 2.57929}, {621.5, 1.81753}, {622,
  1.16792}, {622.5, 0.812681}, {623, 0.790389}, {623.5,
  1.12121}, {624, 1.72601}, {624.5, 2.47269}, {625, 3.20476}, {625.5,
  3.79925}, {626, 4.13864}, {626.5, 4.19772}, {627, 3.89868}, {627.5,
  3.29066}, {628, 2.56193}, {628.5, 1.18217}, {629, 1.201}, {629.5,
  0.839954}, {630, 0.786096}, {630.5, 1.02266}, {631,
  1.54216}, {631.5, 2.25694}, {632, 3.00161}, {632.5, 3.64996}, {633,
  4.10662}, {633.5, 4.25422}, {634, 4.07742}, {634.5, 3.61742}, {635,
  2.95538}, {635.5, 2.19536}, {636, 1.50027}, {636.5, 0.983518}, {637,
   0.74738}, {637.5, 0.832367}, {638, 1.18611}, {638.5,
  1.81069}, {639, 2.52052}, {639.5, 3.21332}, {640, 3.83586}, {640.5,
  4.22302}, {641, 4.26521}, {641.5, 4.04653}, {642, 1.35466}, {642.5,
  2.86817}, {643, 2.10287}, {643.5, 1.43117}, {644, 0.979356}, {644.5,
   0.746969}, {645, 0.822581}, {645.5, 1.18215}, {646,
  1.79122}, {646.5, 2.53364}, {647, 3.26476}, {647.5, 3.88628}, {648,
  4.26317}, {648.5, 4.35906}, {649, 4.14209}, {649.5, 3.64585}, {650,
  2.99705}, {650.5, 2.26706}, {651, 1.56593}, {651.5, 1.0163}, {652,
  0.73207}, {652.5, 0.747088}, {653, 1.07065}, {653.5, 1.63029}, {654,
   2.33737}, {654.5, 3.09604}, {655, 3.78087}, {655.5, 4.23351}, {656,
   4.41608}, {656.5, 4.31326}, {657, 3.90086}, {657.5, 3.25933}, {658,
   2.51208}, {658.5, 1.77755}, {659, 1.19039}, {659.5, 0.82135}, {660,
   0.73459}, {660.5, 0.923318}, {661, 1.37076}, {661.5,
  2.04397}, {662, 2.80493}, {662.5, 3.50803}, {663, 4.05783}, {663.5,
  4.38846}, {664, 4.44331}, {664.5, 4.18948}, {665, 3.66034}, {665.5,
  2.97169}, {666, 2.22196}, {666.5, 1.53033}, {667, 1.00316}, {667.5,
  0.712324}, {668, 0.720476}, {668.5, 1.01816}, {669,
  1.55374}, {669.5, 2.20475}, {670, 1.29344}, {670.5, 3.62008}, {671,
  4.15156}, {671.5, 4.42109}, {672, 1.14064}, {672.5, 4.11829}, {673,
  3.57602}, {673.5, 2.91773}, {674, 2.20852}, {674.5, 1.15511}, {675,
  1.02009}, {675.5, 0.697501}, {676, 0.667976}, {676.5,
  0.885184}, {677, 1.38302}, {677.5, 2.03745}, {678, 2.73663}, {678.5,
   3.40918}, {679, 3.99096}, {679.5, 4.35622}, {680, 4.47979}, {680.5,
   1.14244}, {681, 3.95276}, {681.5, 3.37505}, {682, 2.69638}, {682.5,
   2.00051}, {683, 1.37816}, {683.5, 0.907614}, {684,
  0.677135}, {684.5, 0.689303}, {685, 0.966128}, {685.5,
  1.43516}, {686, 2.06529}, {686.5, 2.74617}, {687, 3.43241}, {687.5,
  3.97529}, {688, 4.33397}, {688.5, 4.49717}, {689, 4.43023}, {689.5,
  4.10693}, {690, 3.57432}, {690.5, 2.92862}, {691, 2.24064}, {691.5,
  1.57001}, {692, 1.06899}, {692.5, 0.732014}, {693,
  0.622801}, {693.5, 0.747907}, {694, 1.09798}, {694.5,
  1.64217}, {695, 2.29531}, {695.5, 2.99002}, {696, 3.61233}, {696.5,
  4.09516}, {697, 4.40627}, {697.5, 1.44823}, {698, 4.31201}, {698.5,
  3.95702}, {699, 3.43039}, {699.5, 2.78007}, {700, 2.12133}, {700.5,
  1.48453}, {701, 0.991509}, {701.5, 0.687136}, {702,
  0.597239}, {702.5, 0.756349}, {703, 1.11419}, {703.5,
  1.67803}, {704, 2.29402}, {704.5, 2.93747}, {705, 3.55918}, {705.5,
  4.07042}, {706, 4.39249}, {706.5, 4.47876}, {707, 4.33559}, {707.5,
  1.19955}, {708, 3.47446}, {708.5, 2.85115}, {709, 2.17851}, {709.5,
  1.55004}, {710, 1.04355}, {710.5, 0.689702}, {711,
  0.576168}, {711.5, 0.721066}, {712, 1.02222}, {712.5,
  1.51412}, {713, 2.14927}, {713.5, 2.78333}, {714, 1.33666}, {714.5,
  3.881}, {715, 4.24701}, {715.5, 4.39667}, {716, 4.33523}, {716.5,
  4.06193}, {717, 3.60485}, {717.5, 2.99235}, {718, 2.35411}, {718.5,
  1.73758}, {719, 1.20277}, {719.5, 0.794537}, {720,
  0.592862}, {720.5, 0.602188}, {721, 0.813372}, {721.5,
  1.19044}, {722, 1.76616}, {722.5, 2.43174}, {723, 3.06058}, {723.5,
  3.61876}, {724, 4.02438}, {724.5, 4.30431}, {725, 4.35566}, {725.5,
  4.22278}, {726, 3.89374}, {726.5, 3.41091}, {727, 2.79258}, {727.5,
  2.15396}, {728, 1.57597}, {728.5, 1.09347}, {729, 0.741331}, {729.5,
   0.57493}, {730, 0.589862}, {730.5, 0.802169}, {731,
  1.18632}, {731.5, 1.68788}, {732, 2.28042}, {732.5, 2.88748}, {733,
  3.44387}, {733.5, 3.88005}, {734, 4.18915}, {734.5, 4.29245}, {735,
  4.22213}, {735.5, 3.98239}, {736, 3.56951}, {736.5, 3.04543}, {737,
  2.50588}, {737.5, 1.93903}, {738, 1.41318}, {738.5, 0.968273}, {739,
   0.659758}, {739.5, 0.527524}, {740, 0.589017}, {740.5,
  0.816269}, {741, 1.1854}, {741.5, 1.67988}, {742, 2.24236}, {742.5,
  2.79845}, {743, 3.31363}, {743.5, 3.75008}, {744, 4.046}, {744.5,
  4.19039}, {745, 4.20304}, {745.5, 3.99817}, {746, 3.67289}, {746.5,
  3.20596}, {747, 1.26866}, {747.5, 2.1237}, {748, 1.58925}, {748.5,
  1.11973}, {749, 0.775268}, {749.5, 0.5622}, {750, 0.512913}, {750.5,
   0.622943}, {751, 0.864436}, {751.5, 1.25483}, {752,
  1.75557}, {752.5, 2.25953}, {753, 1.27832}, {753.5, 3.27403}, {754,
  3.68111}, {754.5, 3.98347}, {755, 4.10839}, {755.5, 4.09297}, {756,
  3.91136}, {756.5, 3.58602}, {757, 3.13645}, {757.5, 2.64106}, {758,
  2.13768}, {758.5, 1.61639}, {759, 1.14512}, {759.5, 0.789583}, {760,
   0.576474}, {760.5, 0.491561}, {761, 0.557119}, {761.5,
  0.771409}, {762, 1.10466}, {762.5, 1.56486}, {763, 2.05591}, {763.5,
   2.58492}, {764, 3.06096}, {764.5, 3.46366}, {765, 3.77391}, {765.5,
   3.95108}, {766, 3.98006}, {766.5, 3.86158}, {767, 3.58974}, {767.5,
   3.23021}, {768, 2.78028}, {768.5, 2.28118}, {769, 1.77211}, {769.5,
   1.30314}, {770, 0.906483}};
plotData = ListLinePlot[Sort[data]]
fourierdata = Abs@Fourier[data[[All, 2]], FourierParameters -> {0, .2}];
ListLinePlot[fourierdata, PlotRange -> {{0, 1000}, {0, 60}}]
A link to the same post in the mathematica.stackexchange.com


