I'm attempting to plot a 3-D figure, and the code is provided below.
ClearAll["Global`*"];
\[Sigma] = 3;
M = 120;
\[Beta] = Sqrt[\[Sigma]^2 + M^2];
ucap[\[Beta]_, r_] := (
  3 \[Beta]^2 ((1 + r \[Beta]^2) BesselI[0,
       2 \[Beta]] - (1 + \[Beta]^2) BesselI[0,
       2 Sqrt[r] \[Beta]]))/((6 + 9 \[Beta]^2 + 2 \[Beta]^4) BesselI[
     0, 2 \[Beta]] -
   6 (1 + \[Beta]^2)^2 Hypergeometric0F1Regularized[2, \[Beta]^2]);

RevolutionPlot3D[
 ucap[\[Beta], r], {r, 0, 1},
 ImageSize -> Large,
 Axes -> None,
 Boxed -> False,
 ColorFunction -> "Rainbow",
 MeshStyle -> {None, None},
 PlotLegends ->
  Placed[BarLegend[{"Rainbow", {0, N[MaxValue[ucap[\[Beta], r], r]]}},
     LabelStyle -> {FontFamily -> "Times New Roman", FontSize -> 35,
      Black}, LegendMarkerSize -> {900, 40}], Above]

 ]

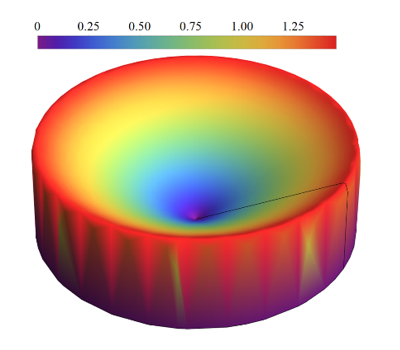
The plot seems OK at M=6, 20, but when I increase M>30, it begins to display some strange coloring near the figure's wall. This might be due to a lower number of points taken near the wall by Mathematica or an abrupt decrease in the value of the function, resulting in the bizarre coloring at the 3D plot's wall. What can I do to solve this? I want it to be as smooth as possible.


