Message Boards Message Boards

0
|
2753 Views
|
3 Replies
|
1 Total Likes
View groups...
Share
Share this post:

Disrupted coloring near the wall of RevolutionPlot3D?

Posted 1 year ago

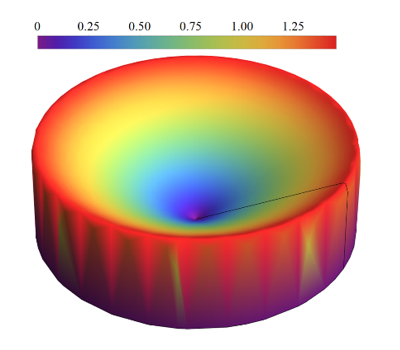
I'm attempting to plot a 3-D figure, and the code is provided below.

ClearAll["Global`*"];
\[Sigma] = 3;
M = 120;
\[Beta] = Sqrt[\[Sigma]^2 + M^2];
ucap[\[Beta]_, r_] := (
  3 \[Beta]^2 ((1 + r \[Beta]^2) BesselI[0, 
       2 \[Beta]] - (1 + \[Beta]^2) BesselI[0, 
       2 Sqrt[r] \[Beta]]))/((6 + 9 \[Beta]^2 + 2 \[Beta]^4) BesselI[
     0, 2 \[Beta]] - 
   6 (1 + \[Beta]^2)^2 Hypergeometric0F1Regularized[2, \[Beta]^2]);

RevolutionPlot3D[
 ucap[\[Beta], r], {r, 0, 1},
 ImageSize -> Large,
 Axes -> None,
 Boxed -> False,
 ColorFunction -> "Rainbow",
 MeshStyle -> {None, None},
 PlotLegends -> 
  Placed[BarLegend[{"Rainbow", {0, N[MaxValue[ucap[\[Beta], r], r]]}},
     LabelStyle -> {FontFamily -> "Times New Roman", FontSize -> 35, 
      Black}, LegendMarkerSize -> {900, 40}], Above]

 ]

enter image description here enter image description here

The plot seems OK at M=6, 20, but when I increase M>30, it begins to display some strange coloring near the figure's wall. This might be due to a lower number of points taken near the wall by Mathematica or an abrupt decrease in the value of the function, resulting in the bizarre coloring at the 3D plot's wall. What can I do to solve this? I want it to be as smooth as possible.

POSTED BY: KRISHAN SHARMA
3 Replies
Posted 1 year ago

Try including the option PlotPoints->64 or larger to the RevolutionPlot3D.

You can even start with PlotPoints->2 and see what that does to the result and then gradually increase the number and see how that changes and if that gets what you need.

The plot will be slower for larger numbers of PlotPoints.

If that doesn't do enough then you might experiment with the WorkingPrecision option. That will slow the plotting down even more If you try that you will probably need to modify your N[] to match the precision.

POSTED BY: Bill Nelson
Posted 1 year ago

Thanks Bill Nelson it worked

POSTED BY: Updating Name

Another way is to use the option BoundaryStyle -> None, because that black line is the boundary of the parametric plot.

POSTED BY: Gianluca Gorni
Reply to this discussion
Community posts can be styled and formatted using the Markdown syntax.
Reply Preview
Attachments
Remove
or Discard

Group Abstract Group Abstract