After the installation of 13.1 my standard tests of my paclet revealed that all function using ListControurPlot3D changed.
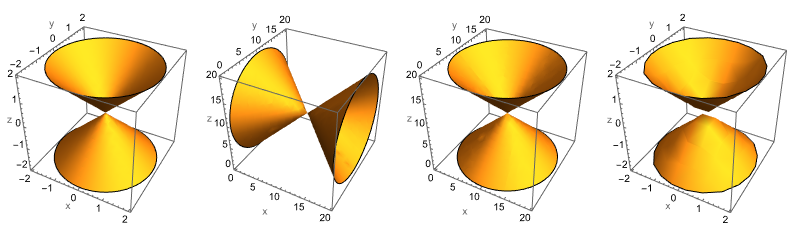
I was always aware that in ListContourPlot3D the data is somehow transposed if you provide it as an array as can be seen in the following code. And for data with isotropic dimensions (21x21x21) it seems that both versions behave the same.
dat = Table[
x^2 + y^2 - z^2, {x, -2, 2, 0.2}, {y, -2, 2, 0.2}, {z, -2, 2, 0.2}];
dat2 = Flatten[
Table[{x, y, z, x^2 + y^2 - z^2}, {x, -2, 2, 0.2}, {y, -2, 2,
0.2}, {z, -2, 2, 0.2}], 2];
Dimensions[dat]
opts = Sequence[{Mesh -> None, AxesLabel -> {"x", "y", "z"},
ImageSize -> 200}];
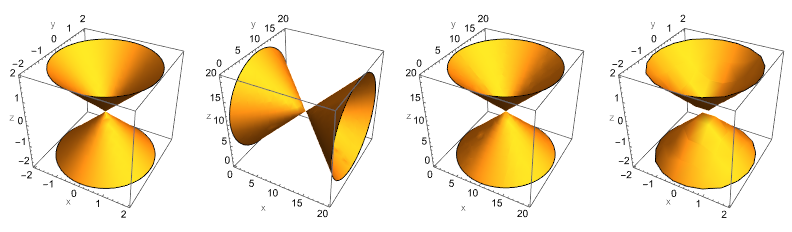
Row[{
ContourPlot3D[
x^2 + y^2 - z^2 == 0, {x, -2, 2}, {y, -2, 2}, {z, -2, 2},
Mesh -> None, AxesLabel -> {"x", "y", "z"}, ImageSize -> 200],
ListContourPlot3D[dat, Contours -> {0}, opts],
ListContourPlot3D[Transpose[dat, {3, 2, 1}], Contours -> {0}, opts],
ListContourPlot3D[dat2, Contours -> {0}, opts]
}]
13.0.1
13.1
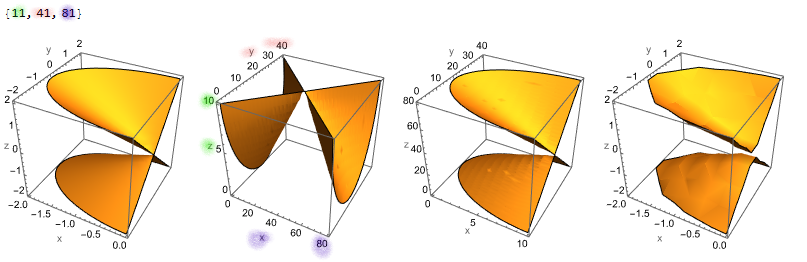
But now consider the same data but with anisotropic dimensions (11x41x81). It has always been that the dimension index would be {z, y, x}. But with 13.1 it changed to {x, y, z}. Which i get since now this function is actually agreeing with the other 3D plotting functions. However, although the axes indexes / labels are changed the data orientation is not but should have been. This is giving wrong plots.
dat = Table[
   x^2 + y^2 - z^2, {x, -2, 0, 0.2}, {y, -2, 2, 0.1}, {z, -2, 2,
    0.05}];
dat2 = Flatten[
   Table[{x, y, z, x^2 + y^2 - z^2}, {x, -2, 0, 0.2}, {y, -2, 2,
     0.1}, {z, -2, 2, 0.05}], 2];
Dimensions[dat]
opts = Sequence[{Mesh -> None, AxesLabel -> {"x", "y", "z"},
    ImageSize -> 200}];
Row[{
  ContourPlot3D[
   x^2 + y^2 - z^2 == 0, {x, -2, 0}, {y, -2, 2}, {z, -2, 2},
   Mesh -> None, AxesLabel -> {"x", "y", "z"}, ImageSize -> 200],
  ListContourPlot3D[dat, Contours -> {0}, opts],
  ListContourPlot3D[Transpose[dat, {3, 2, 1}], Contours -> {0}, opts],
  ListContourPlot3D[dat2, Contours -> {0}, opts]
  }]
13.0.1
13.1
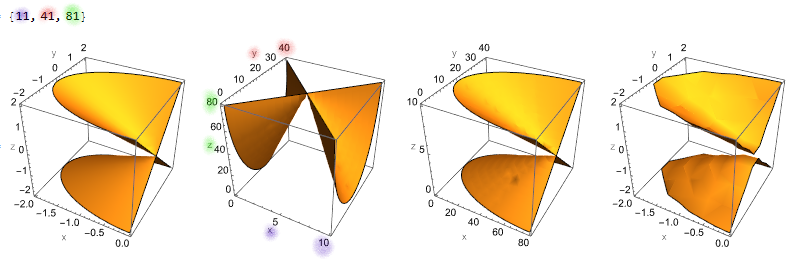
In my opinion both are actually wrong but in 13.0.1 the data orientation was wrong but consistent with the axes. In 13.1 the axes are correct but the data is not consistent with the axes. My workaround used to be to just Transpose the data, now my workaround is to convert the arrays to coordinate lists {x, y, z, f}.
Is this a know issue / bug, or is it by design and am i missing something.


