Studying the symmetry operation of crystals requires a certain ability of spatial imagination. Some symmetry operations are complex and difficult to imagine with our head. By definition, all the symmetry operations of space groups are the ones in three-dimensional space, which can make the configuration of crystal lattice point positions indistinguishable before and after the operation.
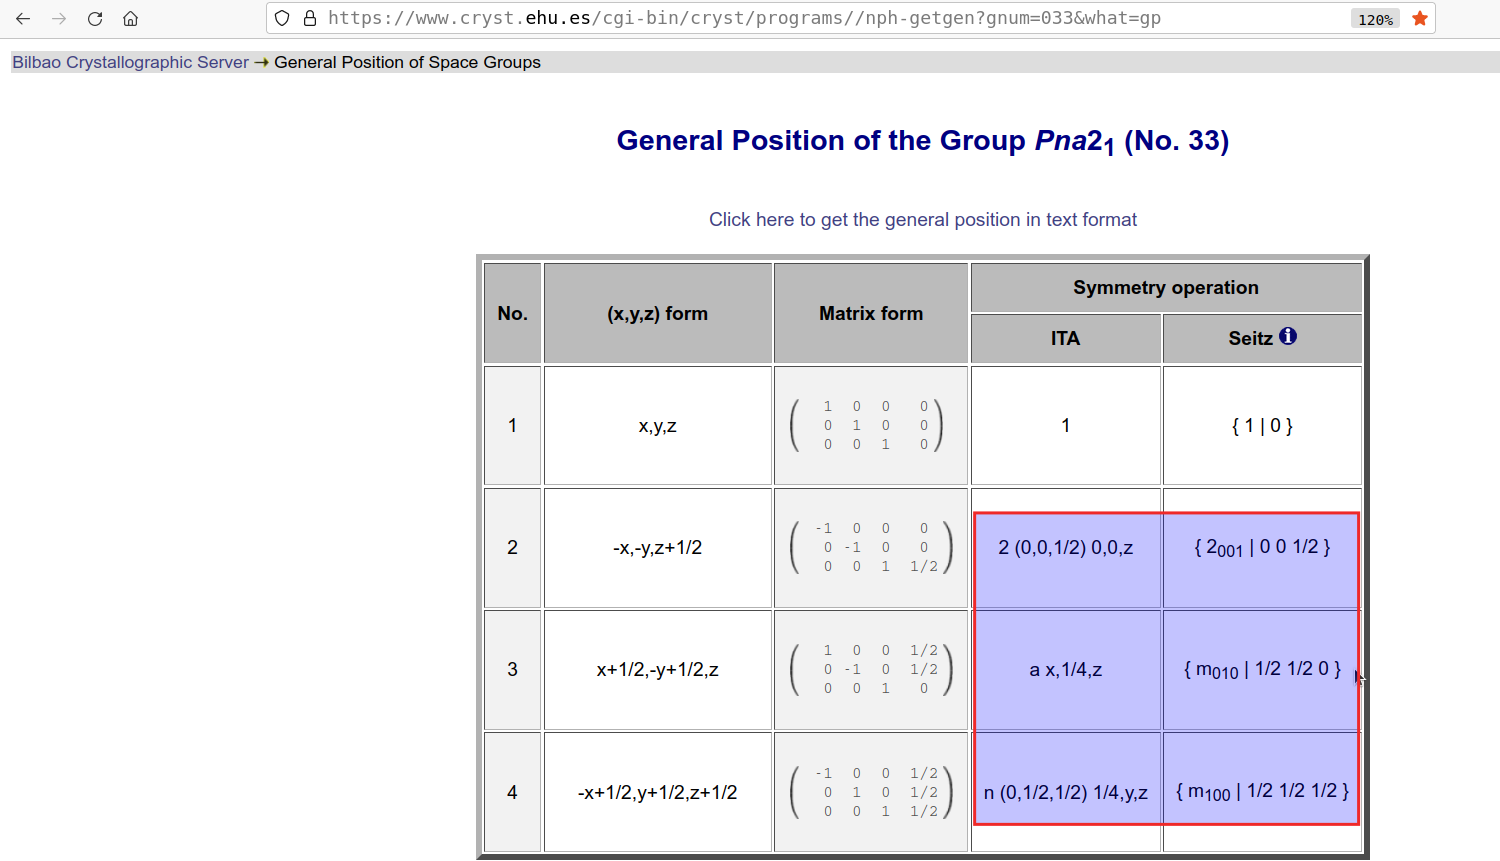
So, I want to use Wolfram to visualize the symmetry operations of space groups in order to facilitate their learning, understanding, and use. Taking the space group Pna21 (No. 33) as an example, as shown below:

For the above-mentioned space group, I've obtained the representation corresponding to the symmetry operations in Wolfram as follows:
In[1]:= rotP = RotationTransform[Pi, {0, 0,1}, {0,0,z}];
P=TransformationMatrix[rotP];
p=TransformationMatrix[TranslationTransform[{0,0,1/2}]];
TransformationFunction[P . p]
TransformationMatrix[%] . {x,y,z,1}

Out[4]= TransformationFunction[( \!\(\*
TagBox[GridBox[{
{
RowBox[{"-", "1"}], "0", "0", "0"},
{"0",
RowBox[{"-", "1"}], "0", "0"},
{"0", "0", "1",
FractionBox["1", "2"]},
{"0", "0", "0", "1"}
},
AutoDelete->False,
GridBoxDividers->{"Columns" -> {{False}},
        "ColumnsIndexed" -> {-2 -> True}, "Rows" -> {{False}},
        "RowsIndexed" -> {-2 -> True}},
GridBoxItemSize->{"Columns" -> {{Automatic}}, "Rows" -> {{Automatic}}}],
#& ]\) )]

Out[5]= {-x, -y, 1/2 + z, 1}

In[6]:= refP = ReflectionTransform[{0,1,0},{x,1/4,z}];
P=TransformationMatrix[refP];
p=TransformationMatrix[TranslationTransform[{1/2,0,0}]];
TransformationFunction[P . p]
TransformationMatrix[%] . {x,y,z,1}

Out[9]= TransformationFunction[( \!\(\*
TagBox[GridBox[{
{"1", "0", "0",
FractionBox["1", "2"]},
{"0",
RowBox[{"-", "1"}], "0",
FractionBox["1", "2"]},
{"0", "0", "1", "0"},
{"0", "0", "0", "1"}
},
AutoDelete->False,
GridBoxDividers->{"Columns" -> {{False}},
        "ColumnsIndexed" -> {-2 -> True}, "Rows" -> {{False}},
        "RowsIndexed" -> {-2 -> True}},
GridBoxItemSize->{"Columns" -> {{Automatic}}, "Rows" -> {{Automatic}}}],
#& ]\) )]

Out[10]= {1/2 + x, 1/2 - y, z, 1}

In[11]:= refP = ReflectionTransform[{1,0,0},{1/4,y,z}];
P=TransformationMatrix[refP];
p=TransformationMatrix[TranslationTransform[{0,1/2,1/2}]];
TransformationFunction[P . p]
TransformationMatrix[%] . {x,y,z,1}

Out[14]= TransformationFunction[( \!\(\*
TagBox[GridBox[{
{
RowBox[{"-", "1"}], "0", "0",
FractionBox["1", "2"]},
{"0", "1", "0",
FractionBox["1", "2"]},
{"0", "0", "1",
FractionBox["1", "2"]},
{"0", "0", "0", "1"}
},
AutoDelete->False,
GridBoxDividers->{"Columns" -> {{False}},
        "ColumnsIndexed" -> {-2 -> True}, "Rows" -> {{False}},
        "RowsIndexed" -> {-2 -> True}},
GridBoxItemSize->{"Columns" -> {{Automatic}}, "Rows" -> {{Automatic}}}],
#& ]\) )]

Out[15]= {1/2 - x, 1/2 + y, 1/2 + z, 1}
I want to know how to visually display these operations dynamically on the corresponding lattices to conveniently observe the process of their symmetry operations. I noticed the excellent presentation on this site, which has a similar purpose as described here, but it only includes all point groups.
Any hints/comments/tips will be appreciated.
Yours, Zhao