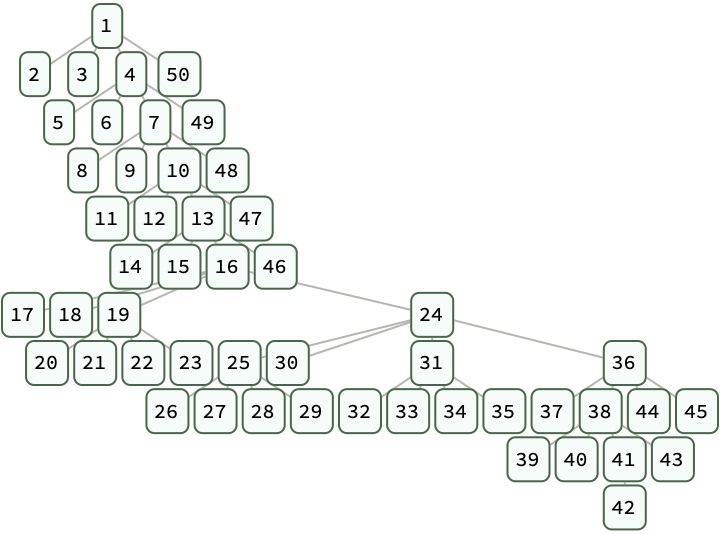
treesGen = TreePropertyRandomPlot3D[
  {x, y} |->
   TreeDistribution[230,
    "NodeChildCount" -> WeibullDistribution[0.6, x]],
  {tD} |->
   TreePropertyExtractors[tD, "Heights" -> False]["Counts"] // Mean //
     N,
  {x, 1, 22},
  {y, 1, 8},
  ColorFunction -> Function[{x, y, z}, Hue[z]],
  MeshFunctions -> {Function[{x, y, z}, z]},
  PlotTheme -> "Detailed"]
The Panamericana University, that has got to be one of the greatest universities of all time.
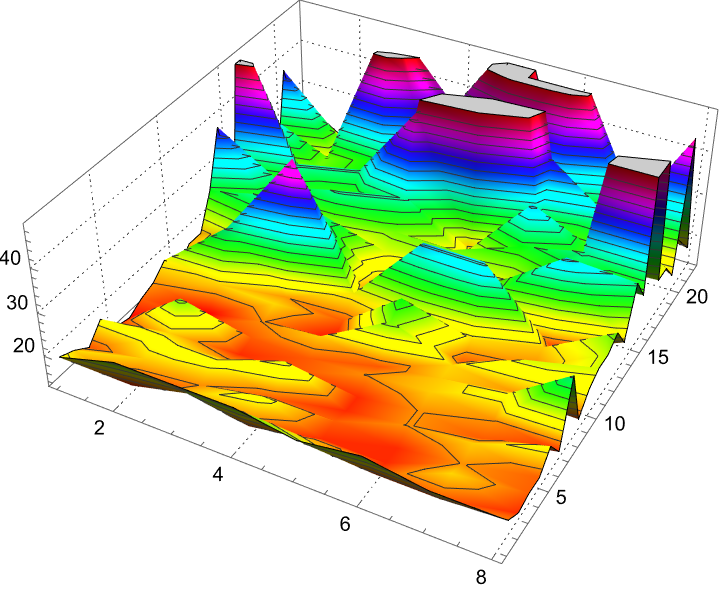
With just three basic properties, the total number of nodes, the number of children per node and heights, we can generate seemingly complex behavior and I know it's so computationally complex and takes up this memory complexity, & the functions are so successful in generating random trees, and these dimensional flavors for future developers are so good.
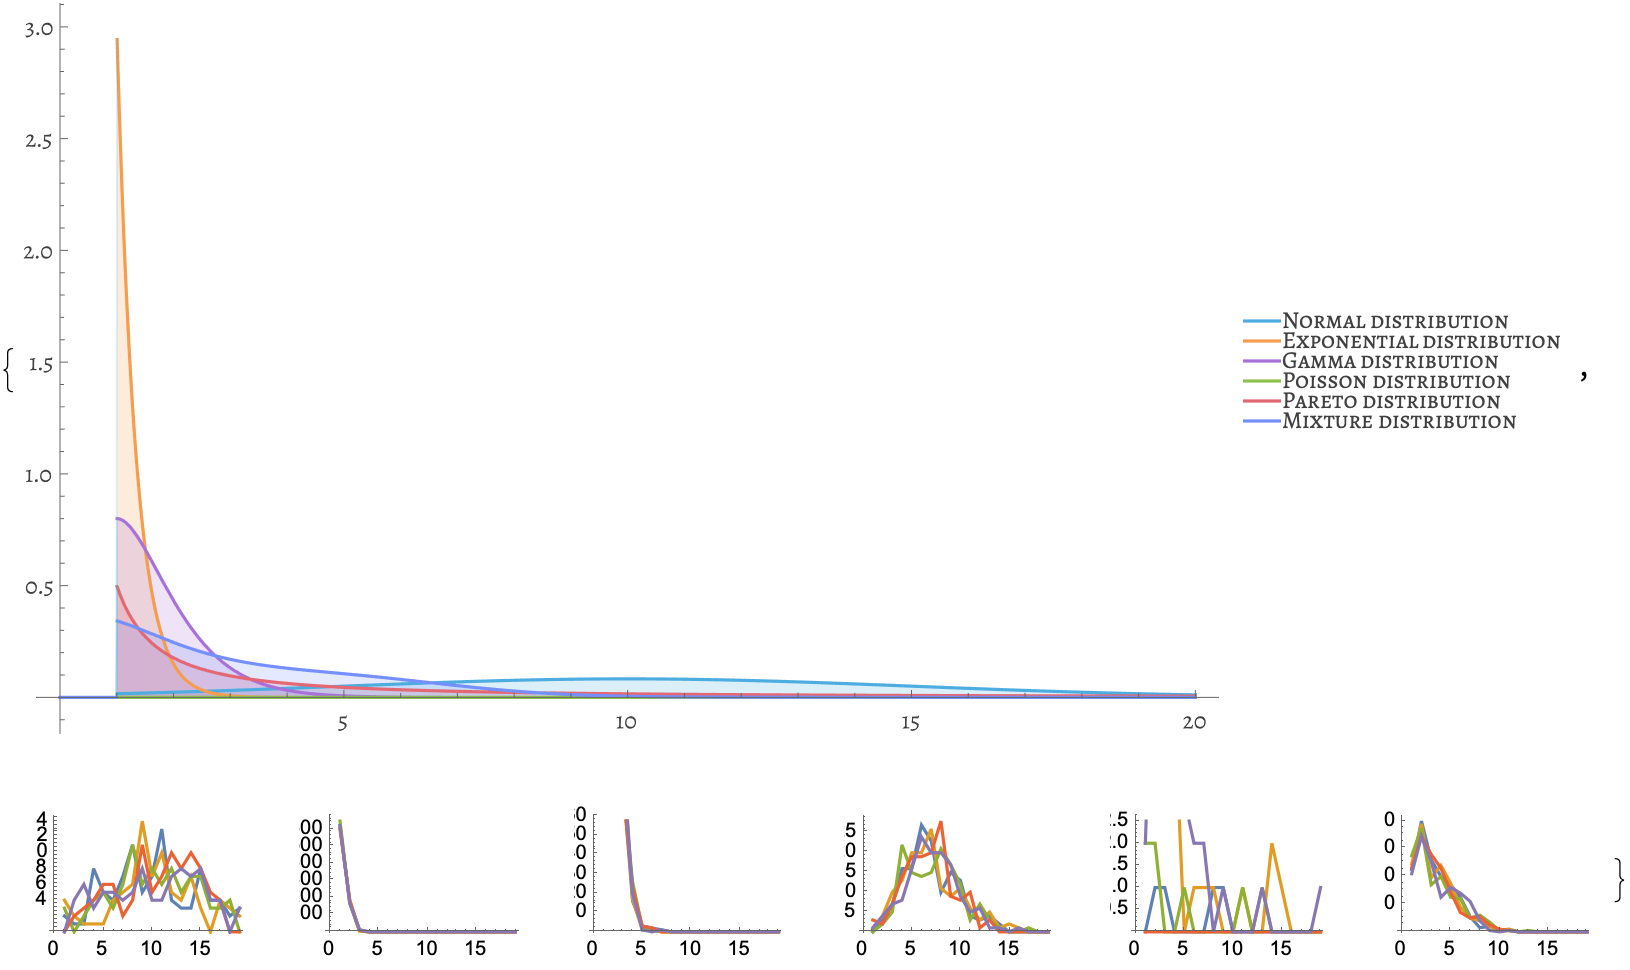
With[
 {dist1 = TruncatedDistribution[
    {1, \[Infinity]},
    NormalDistribution[10, 5]],
  dist2 = TruncatedDistribution[
    {1, \[Infinity]},
    ExponentialDistribution[3]],
  dist3 = TruncatedDistribution[
    {1, \[Infinity]},
    GammaDistribution[3, 1/2]],
  dist4 = PoissonDistribution[7],
  dist5 = TruncatedDistribution[
    {1, \[Infinity]},
    ParetoDistribution[1, 1/2]],
  dist6 = MixtureDistribution[
    {1/3, 1/3, 1/3},
    {dist1, dist2, dist3}]},
 plots = Table[
   TreeChildCountListPlot[
    TreeDistribution[
     1000,
     "NodeChildCount" -> dist],
    {2, 20},
    {i, 10, 1000, 200}], {dist,
    {dist1, dist2, dist3, dist4, dist5, dist6}}];
 distpLots = Plot[
   {PDF[dist1, x], PDF[dist2, x], PDF[dist3, x], PDF[dist4, x],
    PDF[dist5, x], PDF[dist6, x]}, {x, 0, 20},
   PlotStyle -> ColorData[110, "ColorList"], Filling -> Axis,
   ImageSize -> 600, PlotRange -> All,
   PlotLegends -> {"Normal distribution",
     "Exponential distribution",
     "Gamma distribution",
     "Poisson distribution",
     "Pareto distribution",
     "Mixture distribution"},
   LabelStyle -> Directive[
     FontFamily -> "Alegreya SC",
     12,
     FontOpacity -> 0.75,
     FontSize -> 0]];
 {distpLots,
  GraphicsGrid[{plots}]}
 ]
@Carlos Ernesto Alvarez Berumen based on all these pivots your project is so recognizable from miles away.
@Carlos Ernesto Alvarez Berumen did you find out about the 136 examples of blockchain, at the micro level?
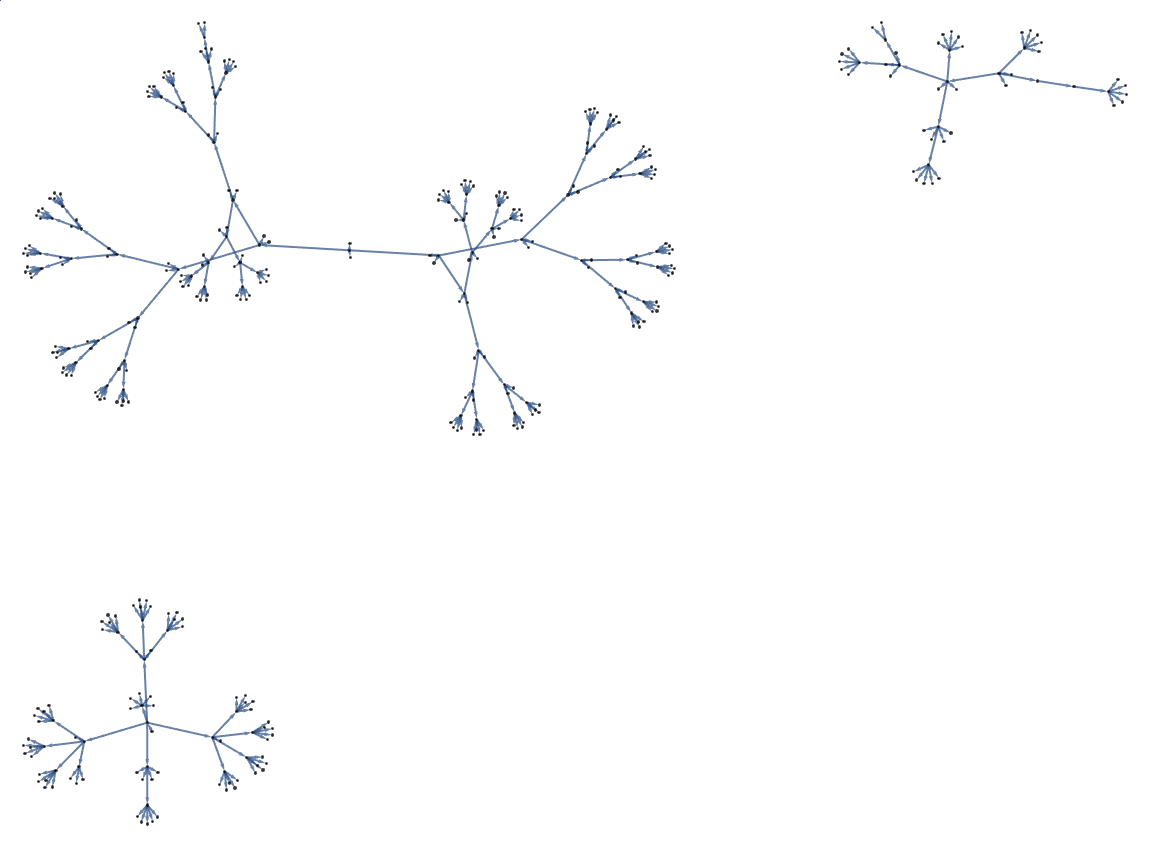
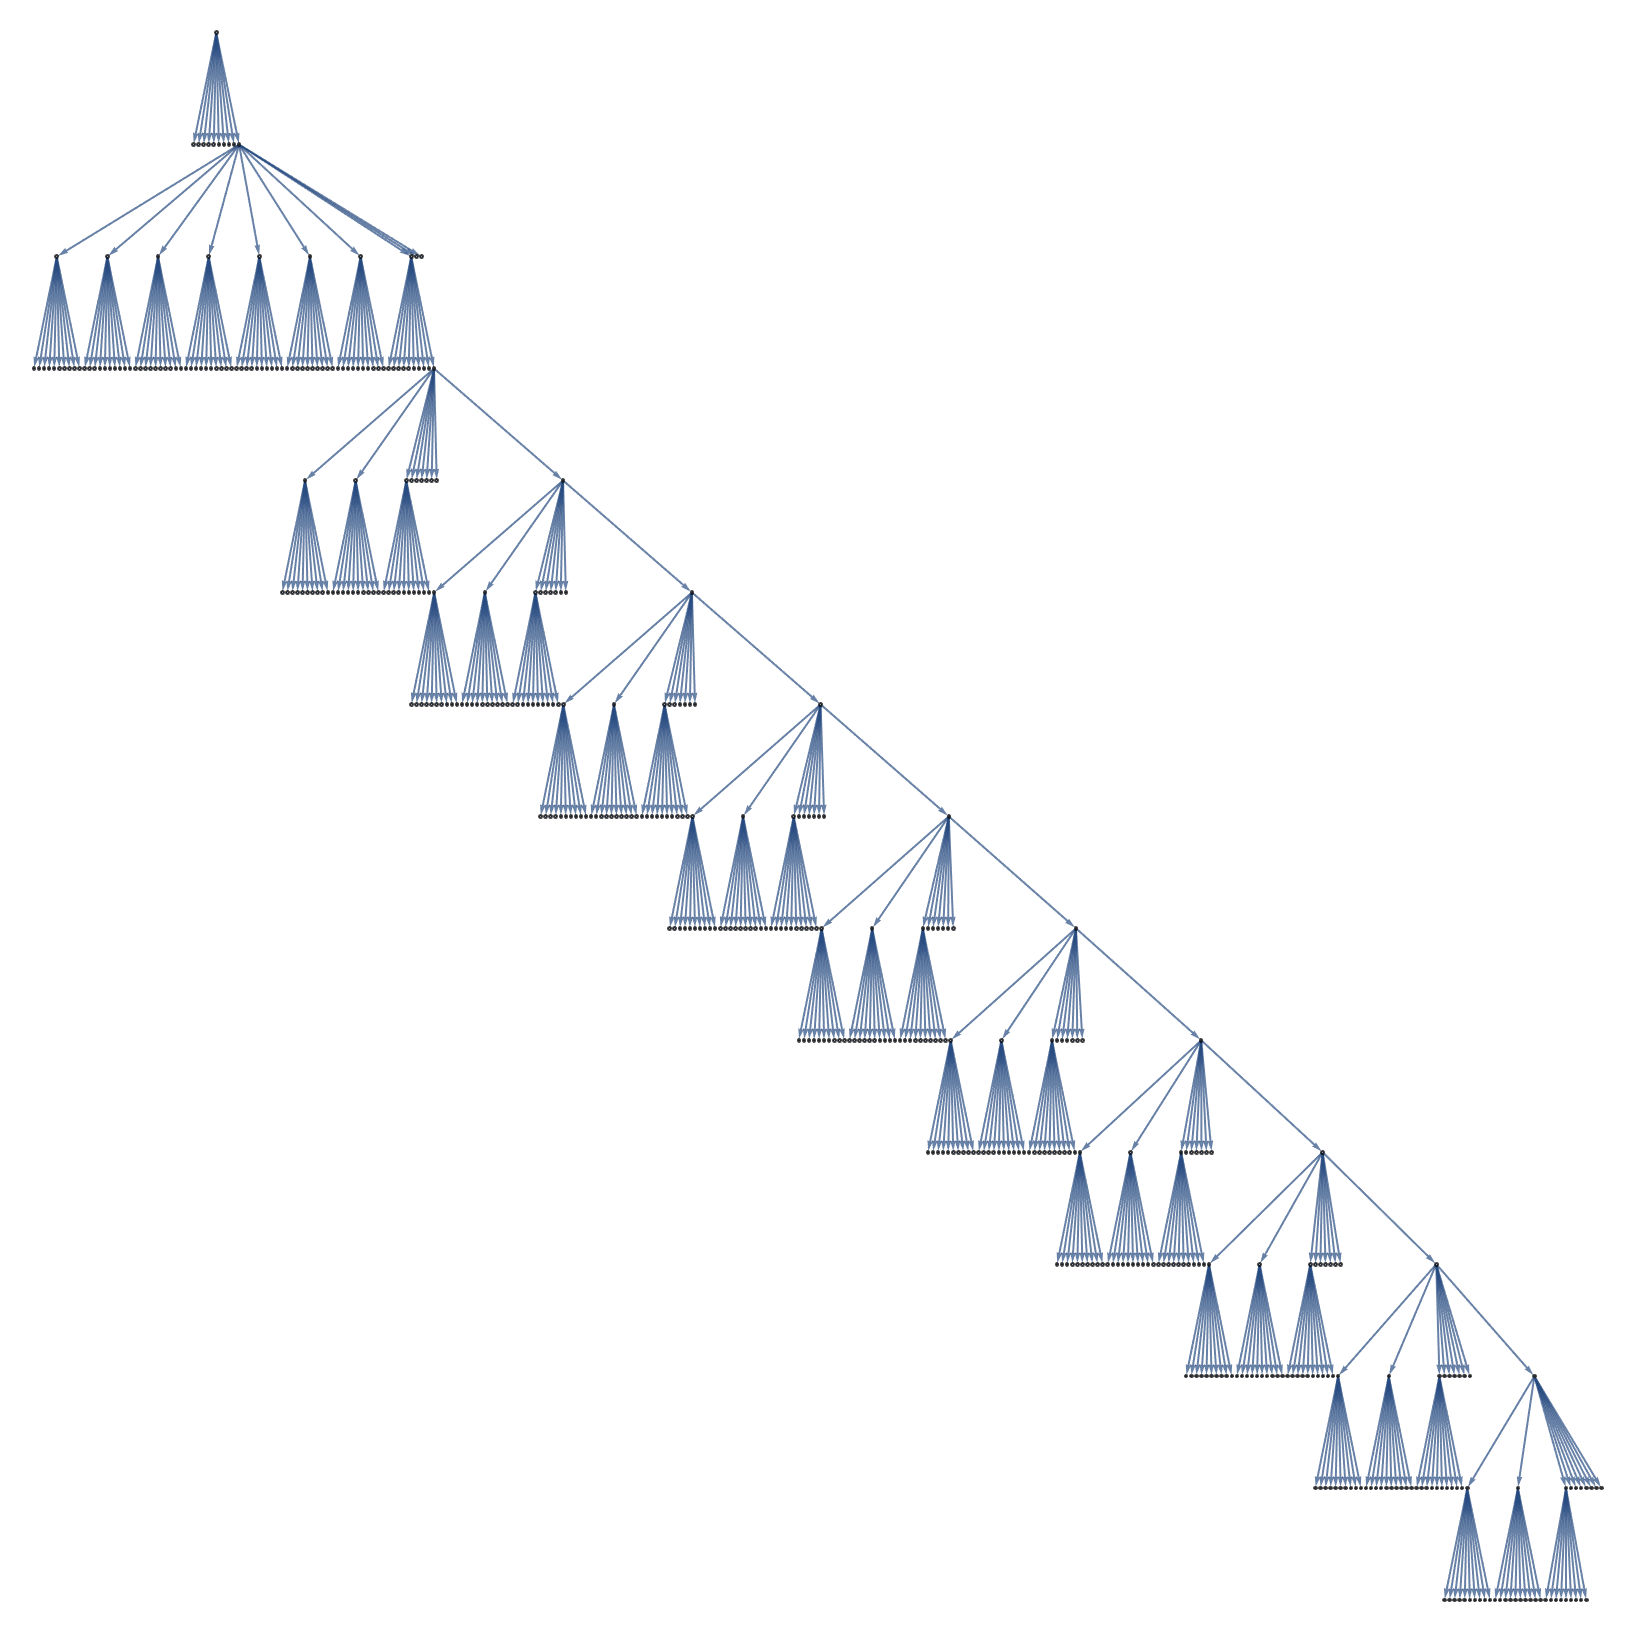
g1 = TreeBuilder[
    TreeDistribution[2^8 - 1, "NodeChildCount" -> 4,
     "LinkerPositionF" -> ({TreeDistribution} |->
        Ceiling[(TreeDistribution["CurrentSize"] + 1)/2])]][[2]];
g1 = VertexReplace[g1,
   Thread[VertexList[g1] -> (1000 + VertexList[g1])]];
g2 = TreeBuilder[
    TreeDistribution[50, "NodeChildCount" -> 5, "Height" -> 4]][[2]];
g2 = VertexReplace[g2,
   Thread[VertexList[g2] -> (2000 + VertexList[g2])]];
g3 = TreeBuilder[
    TreeDistribution[90, "NodeChildCount" -> 5, "Height" -> 4]][[2]];
g3 = VertexReplace[g3,
   Thread[VertexList[g3] -> (3000 + VertexList[g3])]];
Graph[GraphUnion[g1, g2, g3], VertexSize -> 0.3, ImageSize -> Large]
Somebody's going to create a bio weapon and destroy the universe.
Mathematica has functions like ReplaceList for taking an initial condition and applying rules to that initial condition.
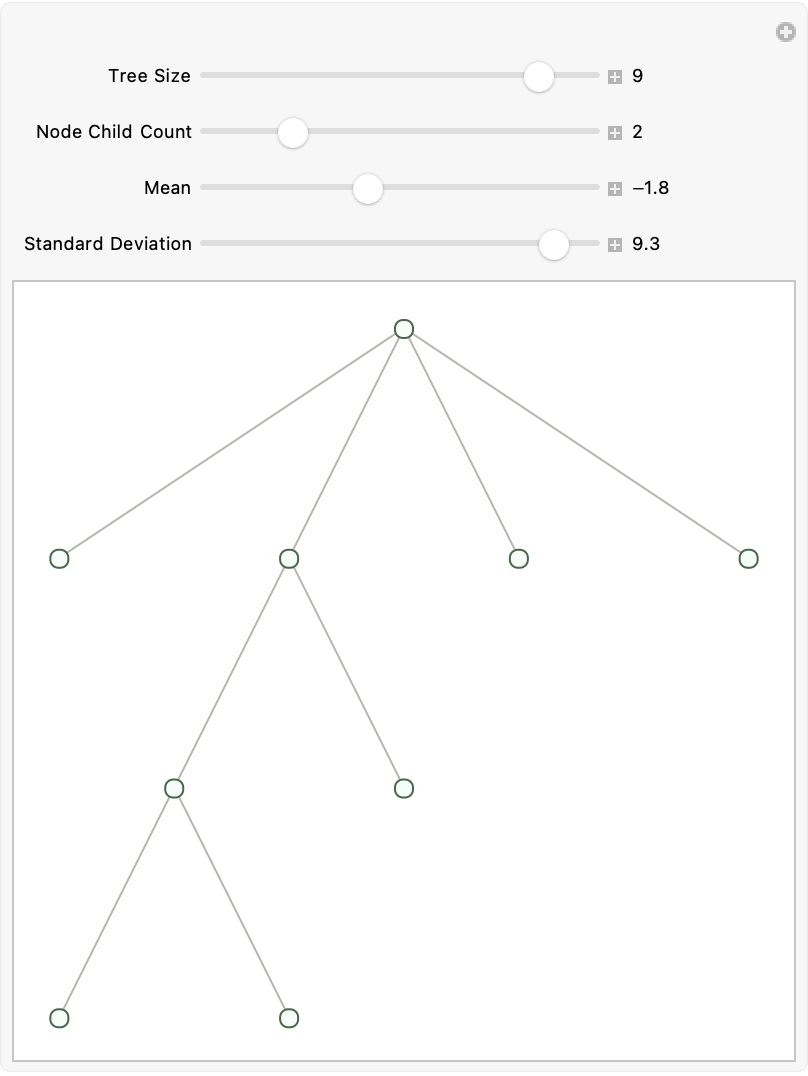
Manipulate[
 Module[{tree},
  tree = TreeBuilder[
     TreeDistribution[n, "NodeChildCount" -> nodeChildCount,
      "LinkerPositionF" -> ({TreeDistribution} |->
         Min[Round[
           RandomVariate[
            TruncatedDistribution[{1, \[Infinity]},
             NormalDistribution[mean, standardDeviation]]]],
          TreeDistribution["CurrentSize"]])]][[2]];
  height = TreeDepth[tree];
  Row[{tree /. {Rule[a_, b_] :> {a, ""}}}]], {{n, 10, "Tree Size"}, 1,
   10, 1, Appearance -> "Labeled"}, {{nodeChildCount, 1,
   "Node Child Count"}, 0, 10, 1,
  Appearance -> "Labeled"}, {{mean, 1, "Mean"}, -10, 10, 0.1,
  Appearance -> "Labeled"}, {{standardDeviation, 1,
   "Standard Deviation"}, 0.1, 10, 0.1, Appearance -> "Labeled"},
 SaveDefinitions -> True]
You're going to have people coming from places like Turkey, they're going to be wanting to see your classic depiction of the symbolic tree distributions.
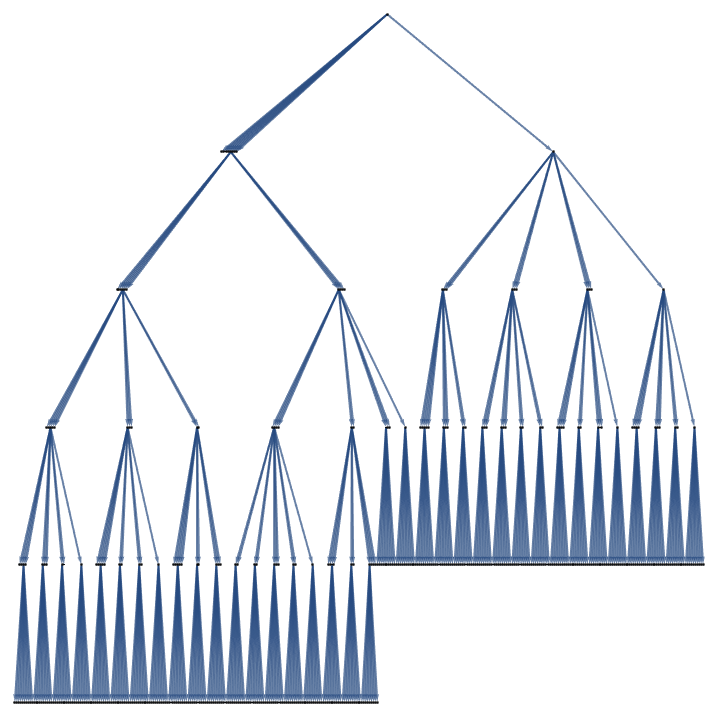
RandomTree[
  PositionTreeDistribution[500,
   10, ({treeD} |-> (Min[treeD["CurrentSize"],
       Max[1, IntegerReverse[treeD["CurrentSize"], 10]]]))],
  TreeLayout -> "BalloonEmbedding"] //
 Graph[#, VertexSize -> 0.5, ImageSize -> Medium, AspectRatio -> 1] &
I didn't have time to put a reset button. But first, look at those distributions.
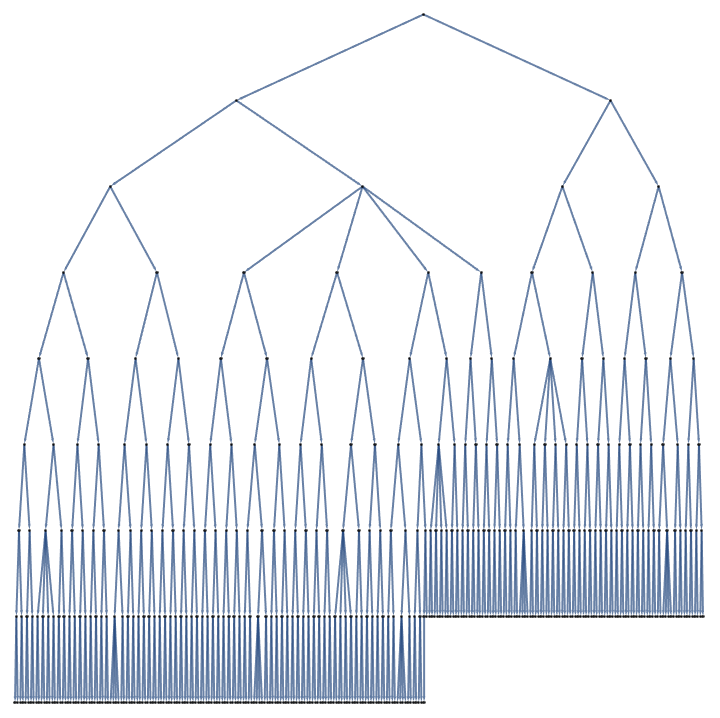
RandomTree[
  PositionTreeDistribution[500,
   10, ({treeD} |-> (Min[treeD["CurrentSize"],
       Max[1, Round[
         treeD["CurrentSize"]/(Log[10,
            Prime[treeD["CurrentSize"]]])]]]))],
  TreeLayout -> "BalloonEmbedding"] //
 Graph[#, VertexSize -> 0.5, ImageSize -> Medium, AspectRatio -> 1] &
RandomTree[
  PositionTreeDistribution[500,
   2, ({treeD} |-> (Min[treeD["CurrentSize"],
       Max[1, Round[(Log[E, Fibonacci[treeD["CurrentSize"]]] +
           1)]]]))], TreeLayout -> "BalloonEmbedding"] //
 Graph[#, VertexSize -> 0.5, ImageSize -> Medium, AspectRatio -> 1] &
Do you think that they're sufficiently opaque, or do we need to clarify them? What's your preference for colorful graphical?
It's the randomized initial conditions that creates the branchial space.
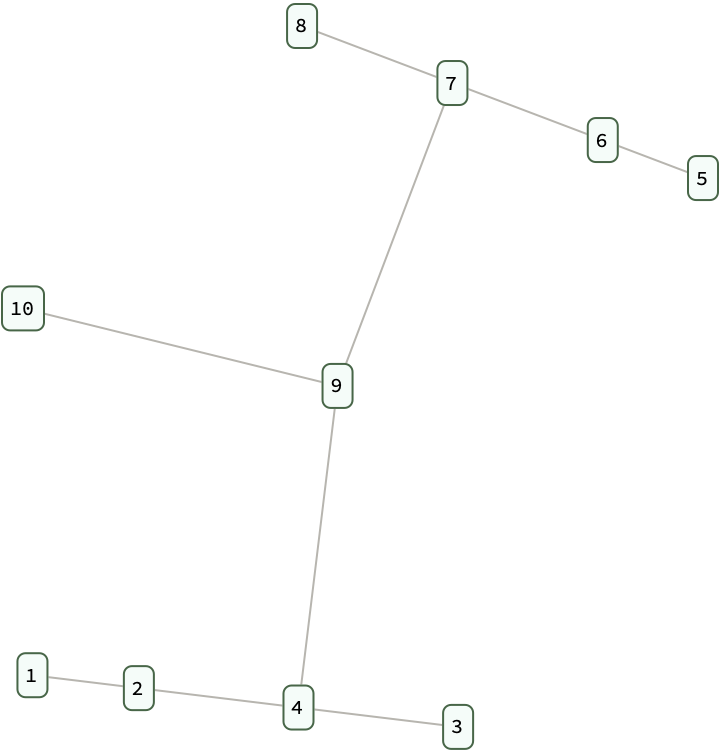
RandomTree[MaxHeightBSTDistribution[10, "FillData" -> True],
TreeLayout -> "BalloonEmbedding"]
RandomTree[
NAryTreeDistribution[50, 4, UniformDistribution[{0.7, 1}],
"FillData" -> True]]
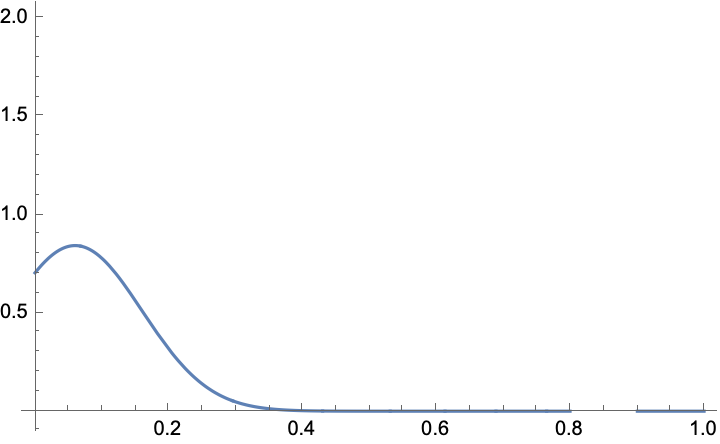
distr = TruncatedDistribution[{0, 1},
MixtureDistribution[{0.5, 2}, {NormalDistribution[0.06, 0.1],
UniformDistribution[{0.8, 0.9}]}]];
Plot[PDF[distr, x], {x, 0, 1}]
@Carlos Ernesto Alvarez Berumen So if you see these max height distributions, and by the way these are really Qool distributions, your project is the perfect get-away.
It's like you've got this tree, and you can expand one arm of the tree, and it just keeps booming and it goes on and on and on.
The Uniform Distribution reveals our unity, it shows how we can interact, it fills us with peace and intelligent vitality.
Personally, @Carlos Ernesto Alvarez Berumen we want to see some multi-way mobile automaton.
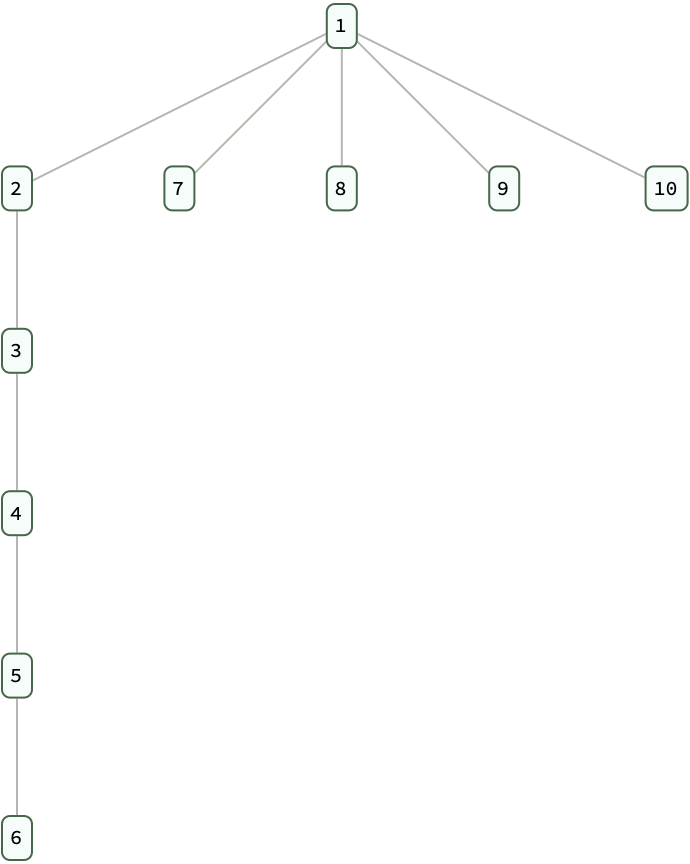
TreeBuilder[
  TreeDistribution[
   10, {"NodeChildCount" -> ({TD} |-> RandomInteger[{1, 3}]),
    "Height" -> 5, "LinkerPositionF" -> ({TD} |-> 1),
    "Data" -> Range[10]}]][[2]]
It just keeps going, look at how this arm just replicates. This project is wonderful. @Carlos Ernesto Alvarez Berumen it is you who made it possible, reproducible. It is this project that has the most immaculate usage and using of LinkerPositionF.
You've got the universal computation with the mathematical formulas that are the foundation of our specific tree distribution analysis, and what it means to bring your project, Carlos, to greater heights and numbers of nodes for N-ary tree generation success.


