In studying large finite groups, that kind of numerology has paid off in terms of noticing in Mathematics a connection was found between this source of sequences. Numerology has even worse history in human-oriented areas. It's kind of, there are many examples of people trying this, the numerological song that we can construct from the strength of the electromagnetic forces that happens to be dimensionless it's just a number, 1 / 47. We should be able to derive this from something lower level, we should be able to derive a fine structure constant. One day I would hope that our theory of physics would be able to do that. It's worth realizing as a footnote to that story that the value of 1/137 is the observer who in the uncertainty principle relates energy to length scales, an observer who is measuring electromagnetic forces on a length scale. The effective value of the fine structure constant changes. The thing that falls out of the theory has to be something that depends on the value of the observer who's observing the thing. What does it mean to make a fairly accurate thumbnail? Here you will find a generalized approach beyond notebooks and thumbnails to cover a wider range of images. We could have also introduced additional image processing techniques--such as custom edge padding and multiple padding alternatives--to further witness the effects of augmentation on network predictions. The following sections describe more than just one component of the generational thumbnail system and explain the code blocks in detail, that's the project's focus.
randomImages =
  Table[Quiet[
    Check[Import["https://picsum.photos/192/143"], $Failed]], {10}];
randomImages = DeleteCases[randomImages, $Failed];
wreckedImages = wreckThumbnail /@ randomImages;
imageDataset =
  AssociationThread[Range[Length[randomImages]],
   Table[<|"Original" -> randomImages[[i]],
     "Wrecked" -> wreckedImages[[i]]|>, {i, Length[randomImages]}]];
Manipulate[
 Column[{Grid[{{"Original Image",
      "Wrecked Image"}, {imageDataset[n]["Original"],
      imageDataset[n]["Wrecked"]}}, Frame -> All],
   Button["Export Gallery as PDF",
    Export["C:\\Users\\mtchi\\Downloads\\Wolfram (Windows)\\My \
Project\\thumbnails_final\\gallery.pdf",
     Grid[{{"Original Image",
        "Wrecked Image"}, {imageDataset[n]["Original"],
        imageDataset[n]["Wrecked"]}}, Frame -> All]]]}], {n, 1,
  Length[randomImages], 1}]
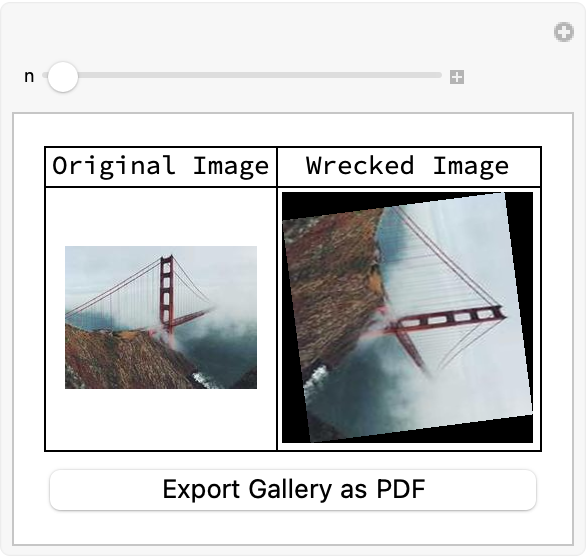
With regard to the image dataset and gallery creation, if you've seen one thumbnail then you know, that the generation and classification of thumbnails extracted from Wolfram Notebooks is done by fetching random images from an online API (Picsum Photos) without relying on URLExecute for every call..what we can do then is not only speed up the process but also make it feasible for us to work with a more full set of images. What we can do then is fetch the random images via the Table operator which makes it possible to generate an images list via the import from a URL that is fixed in size.
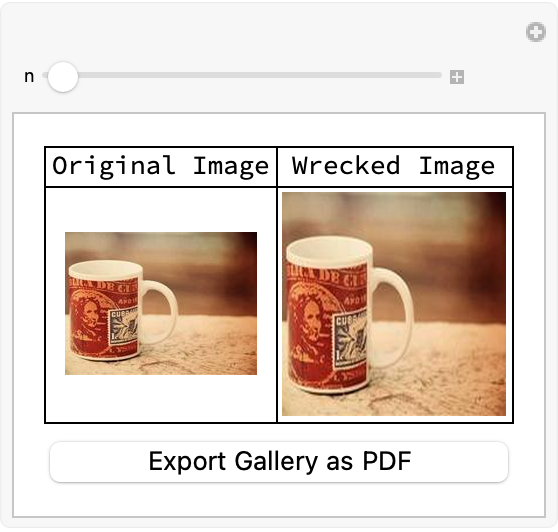
The simulation of image degradation or "wrecking" is done via the function called wreckThumbnail, which we can then combine that with the original and processed images into an "association" of classifications, whereby a pre-trained network (loaded as trainedNet) is used to predict the top probabilities for each image. Then and then this is something..when you see a gallery that is interactive you actually want to speed up the user interface's capacity to cycle through the images, and display then both the original and wrecked versions, and then show some classification results.

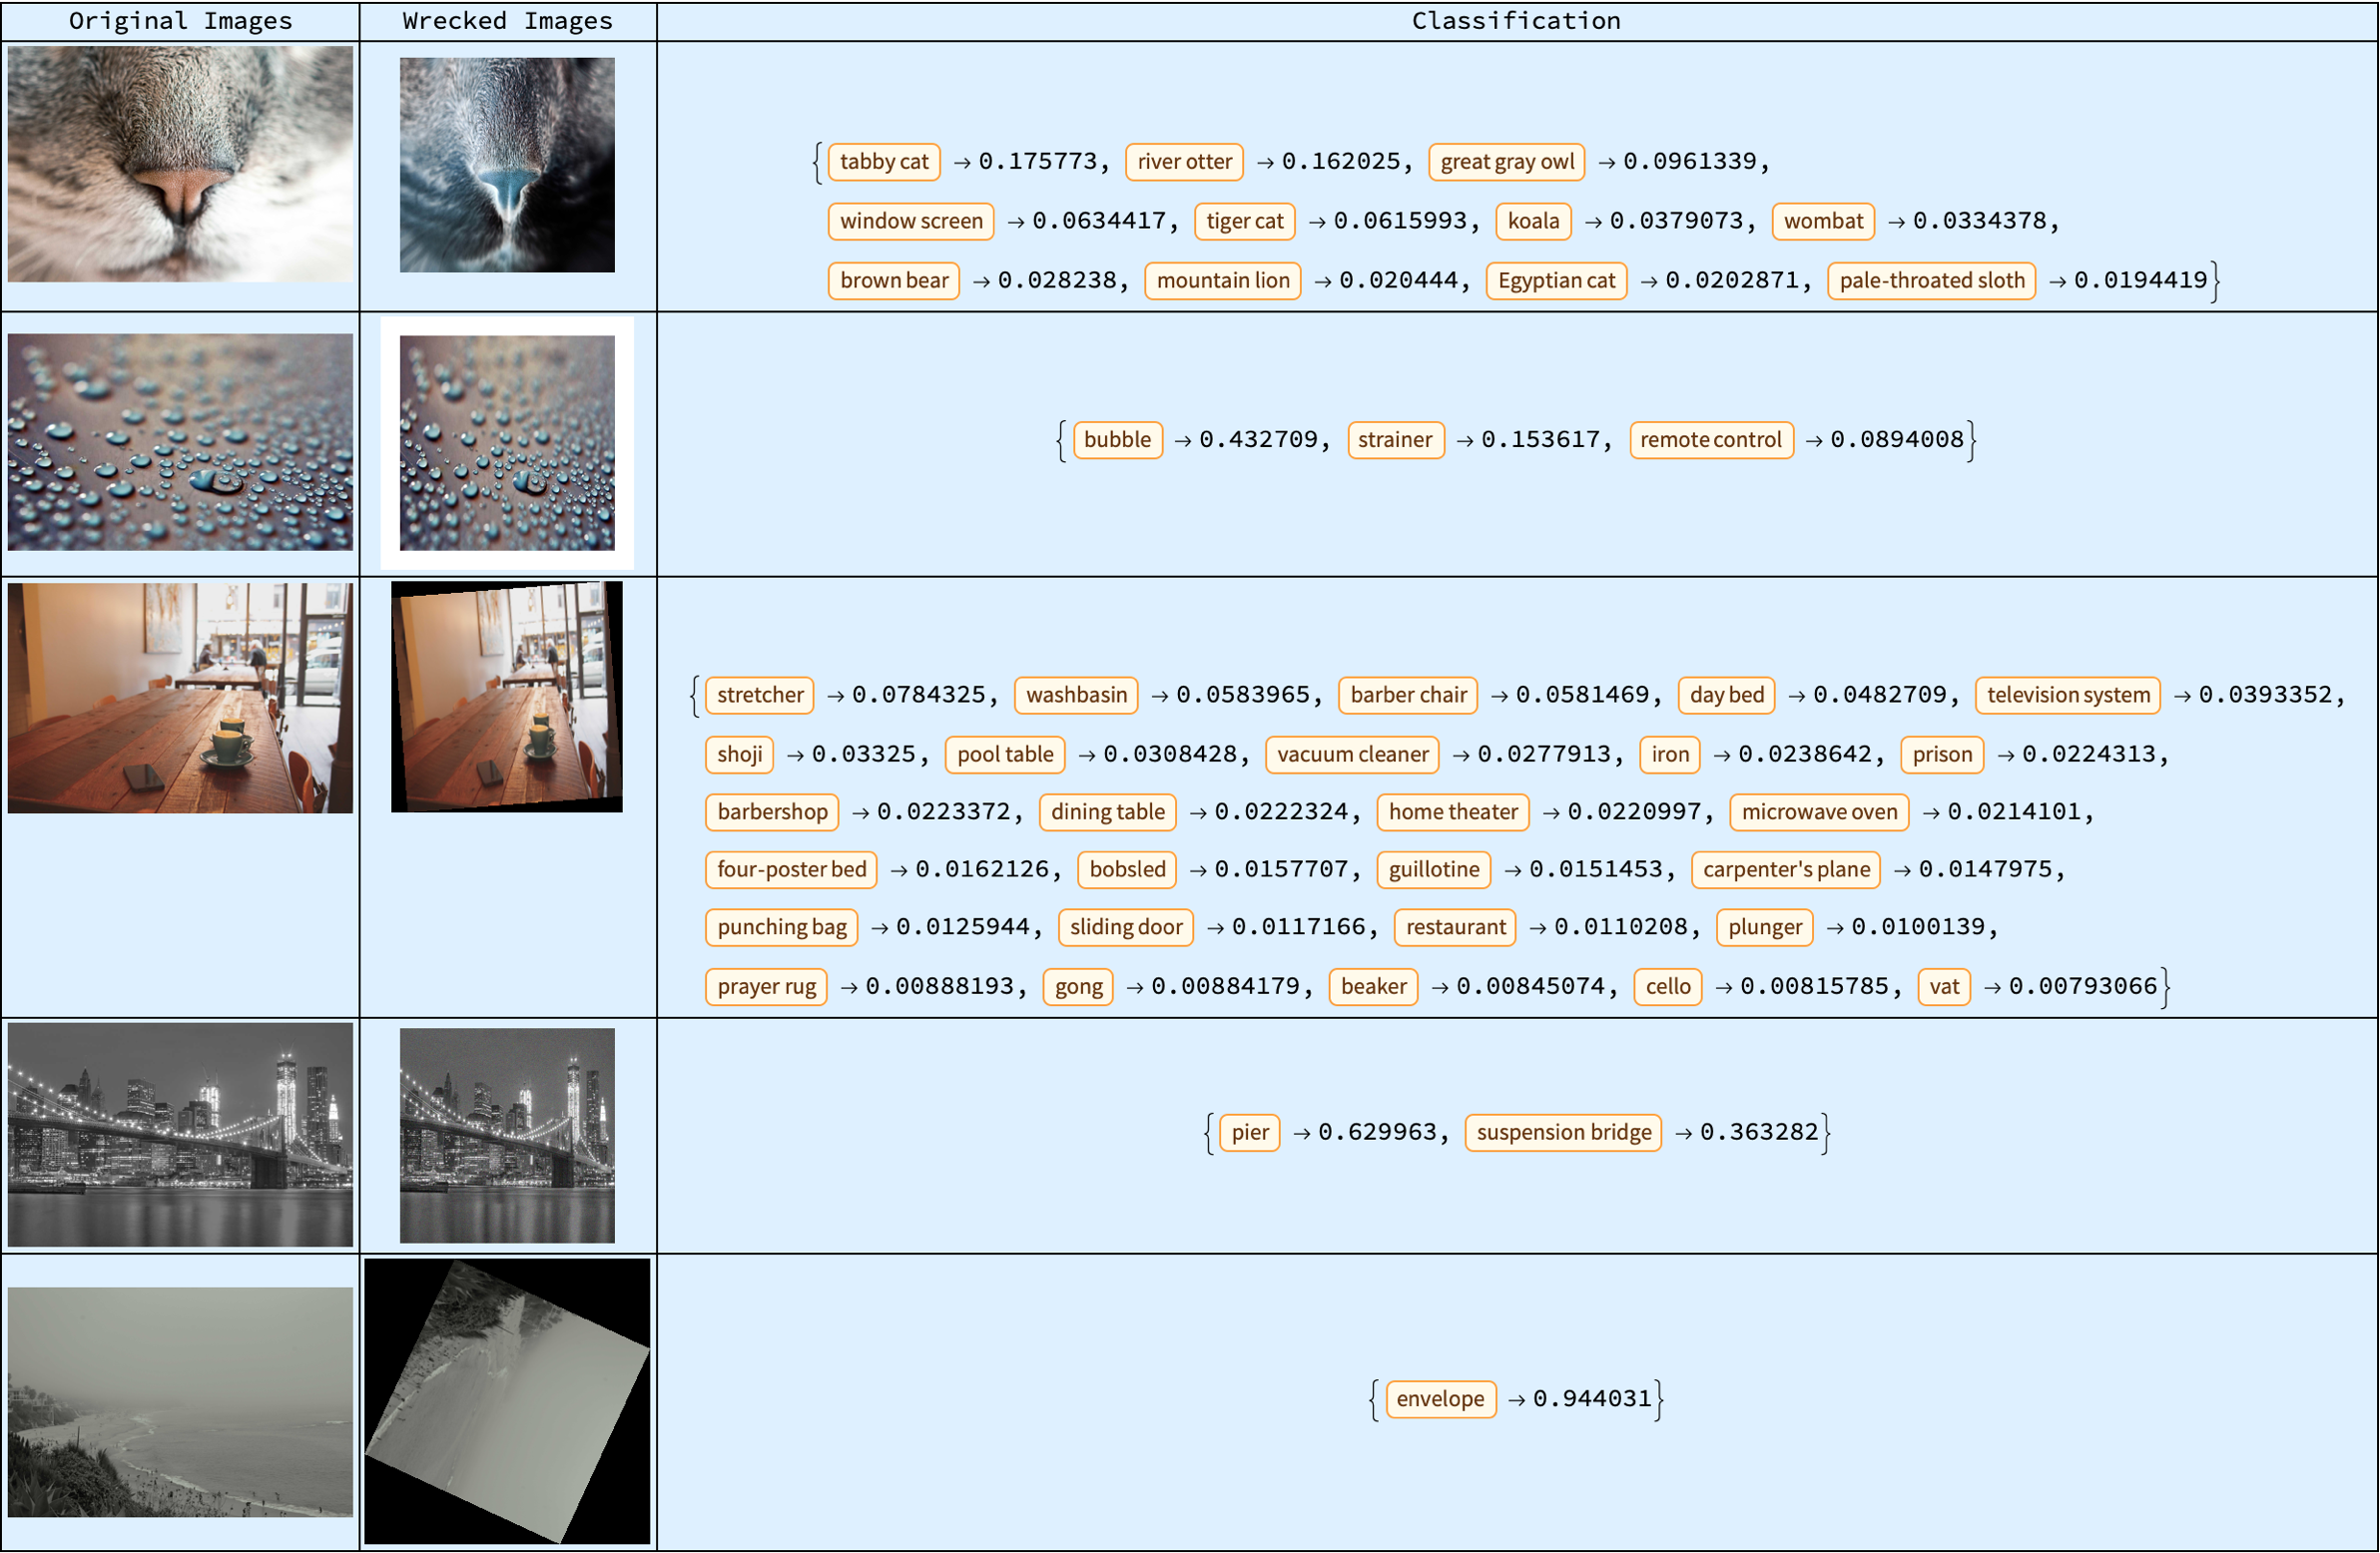
Showing classification results is only something that I would do once in a lifetime and in that sense the "wrecking" process on the images also gives us immediate feedback from the neural network classifier...what we can do then is integrate the API online and then gain some padding for the customization component. This padding itself can be constructed via the definition of a function that queries the Picsum Photos API and then processes the fetched images using the function wreckThumbnail and then classifying them as usual functionally and then after that, that being via the pre-trained Inception V1 network, we combine that with an edgePadding function and start advanced padding techniques that use the source image's edges to "fill in" extra space. This is especially useful when the augmentation should preserve structural elements, of the image.
fetchRandomImages[n_Integer] :=
Module[{response, urls},
response =
URLExecute[
"https://picsum.photos/v2/list", {"page" ->
RandomInteger[{1, 10}], "limit" -> n}];
urls = Lookup[response, "download_url"];
Import /@ urls]
processImages[images_] := {images, wreckThumbnail /@ images}
classifyImages[images_, net_] := net[images, "TopProbabilities"]
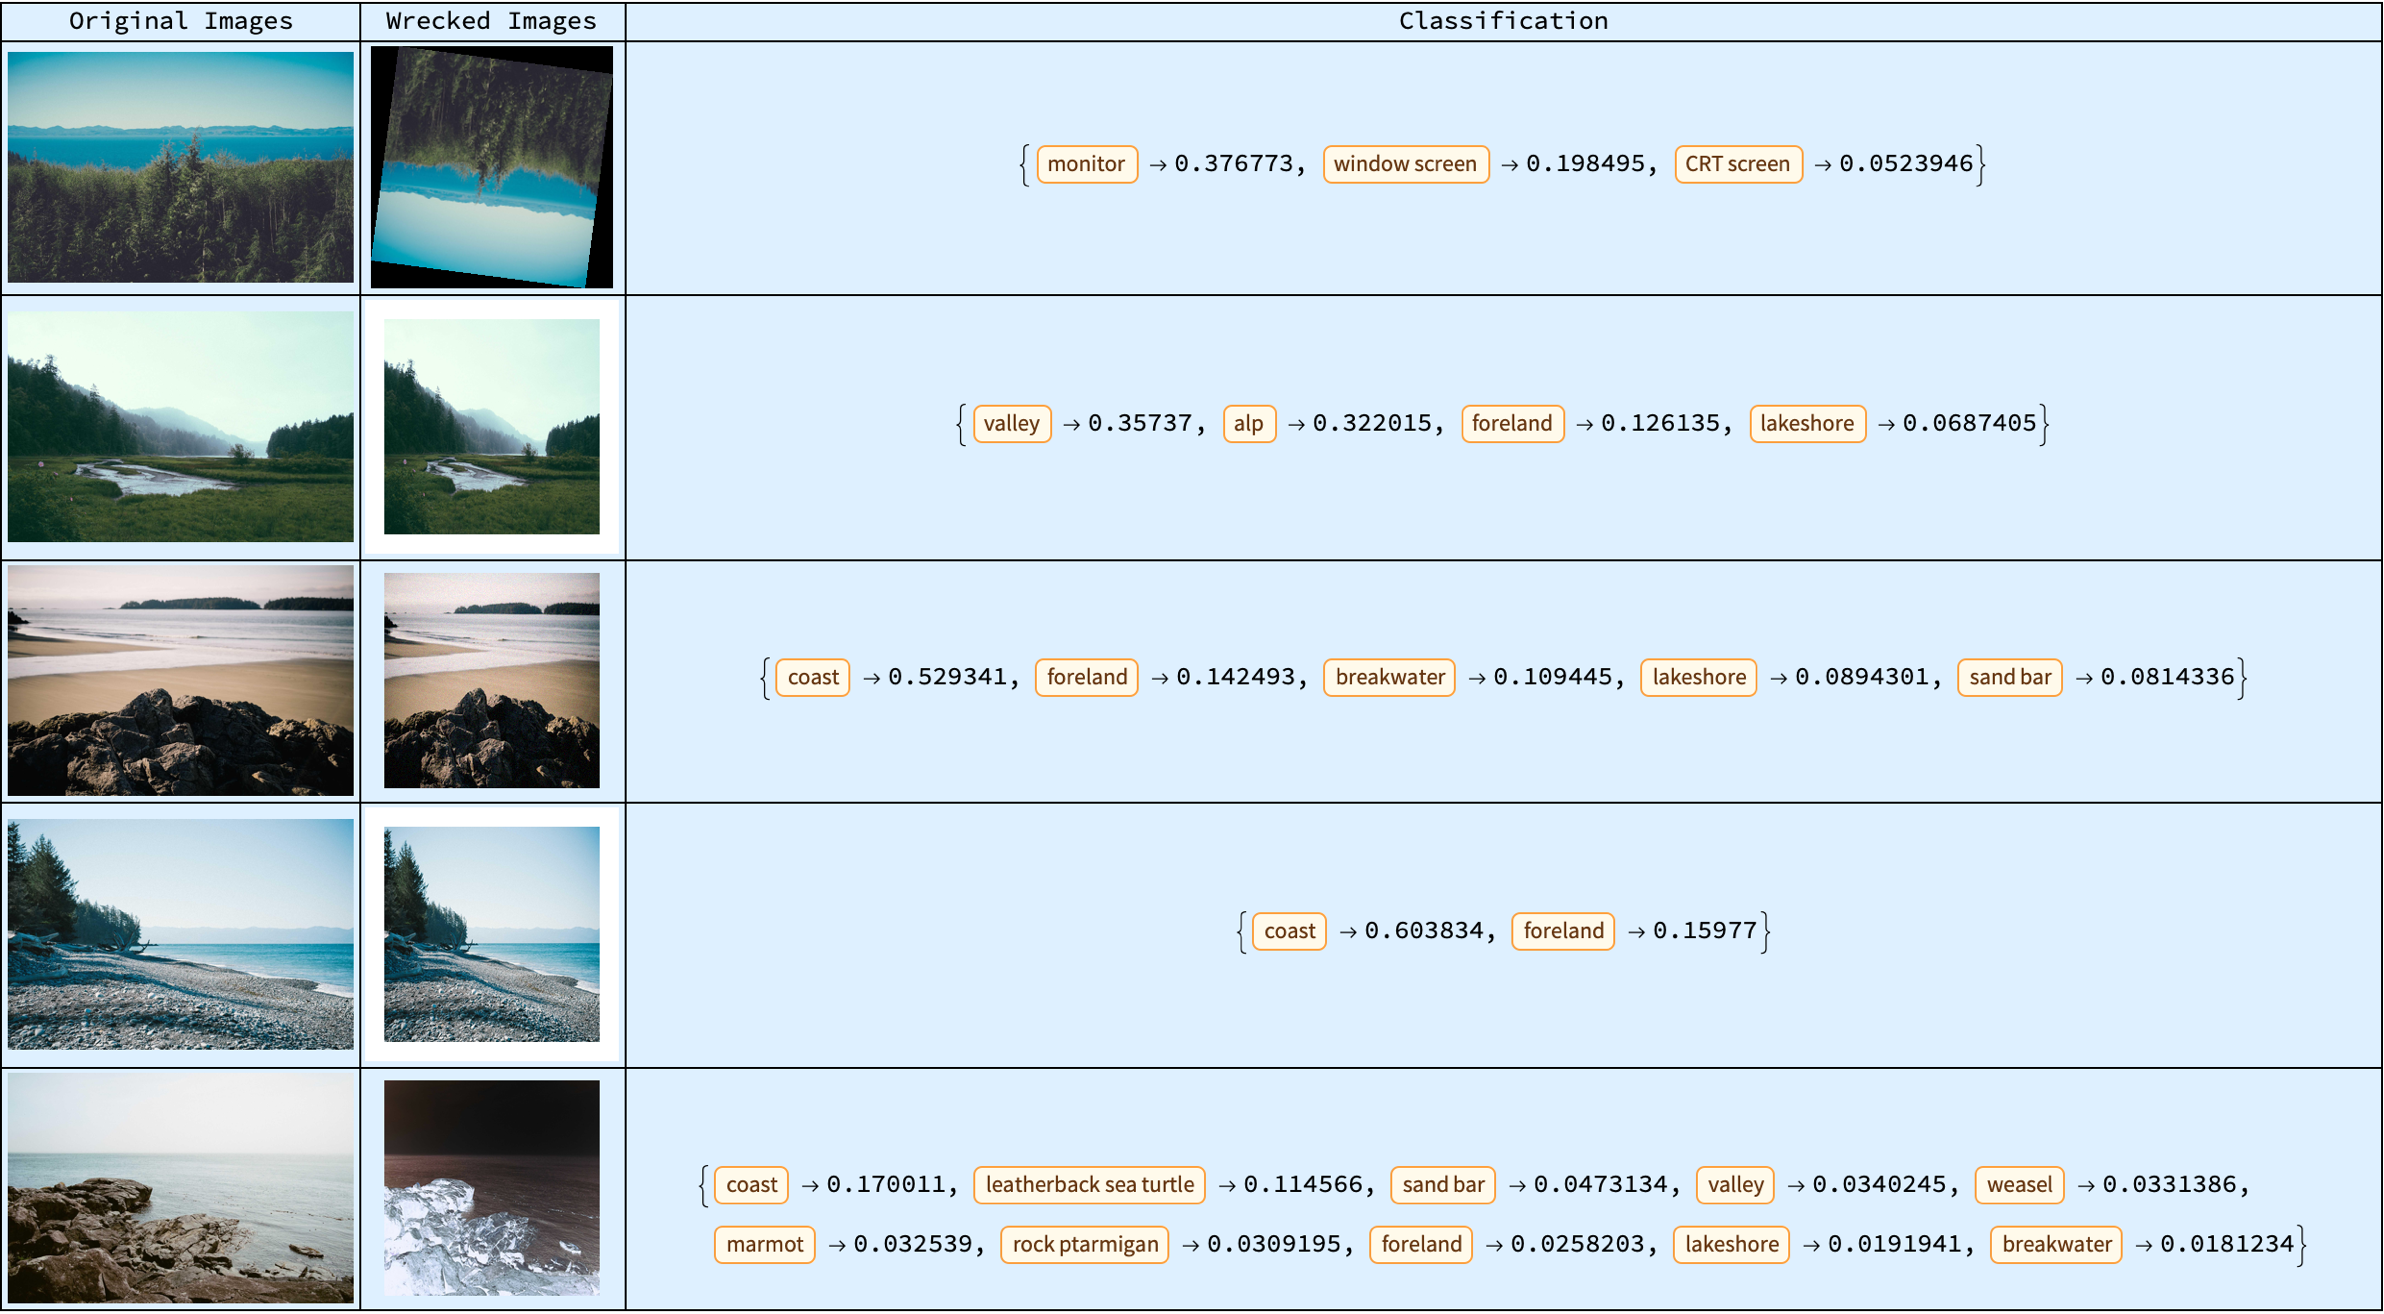
displayGallery[originalImages_, wreckedImages_, classifications_] :=
Module[{rows},
rows = MapThread[{#1, #2, #3} &, {originalImages, wreckedImages,
classifications}];
Dynamic@
Grid[Prepend[
rows, {"Original Images", "Wrecked Images", "Classification"}],
Frame -> All, Alignment -> Center, Background -> LightBlue]]
generateThumbnailGallery[n_Integer] :=
Module[{images, originalImages, wreckedImages, net, classifications},
images = fetchRandomImages[n];
{originalImages, wreckedImages} = processImages[images];
net = NetModel[
"Inception V1 Trained on ImageNet Competition Data"];
classifications = classifyImages[wreckedImages, net];
displayGallery[originalImages, wreckedImages, classifications]]
generateThumbnailGallery[5]
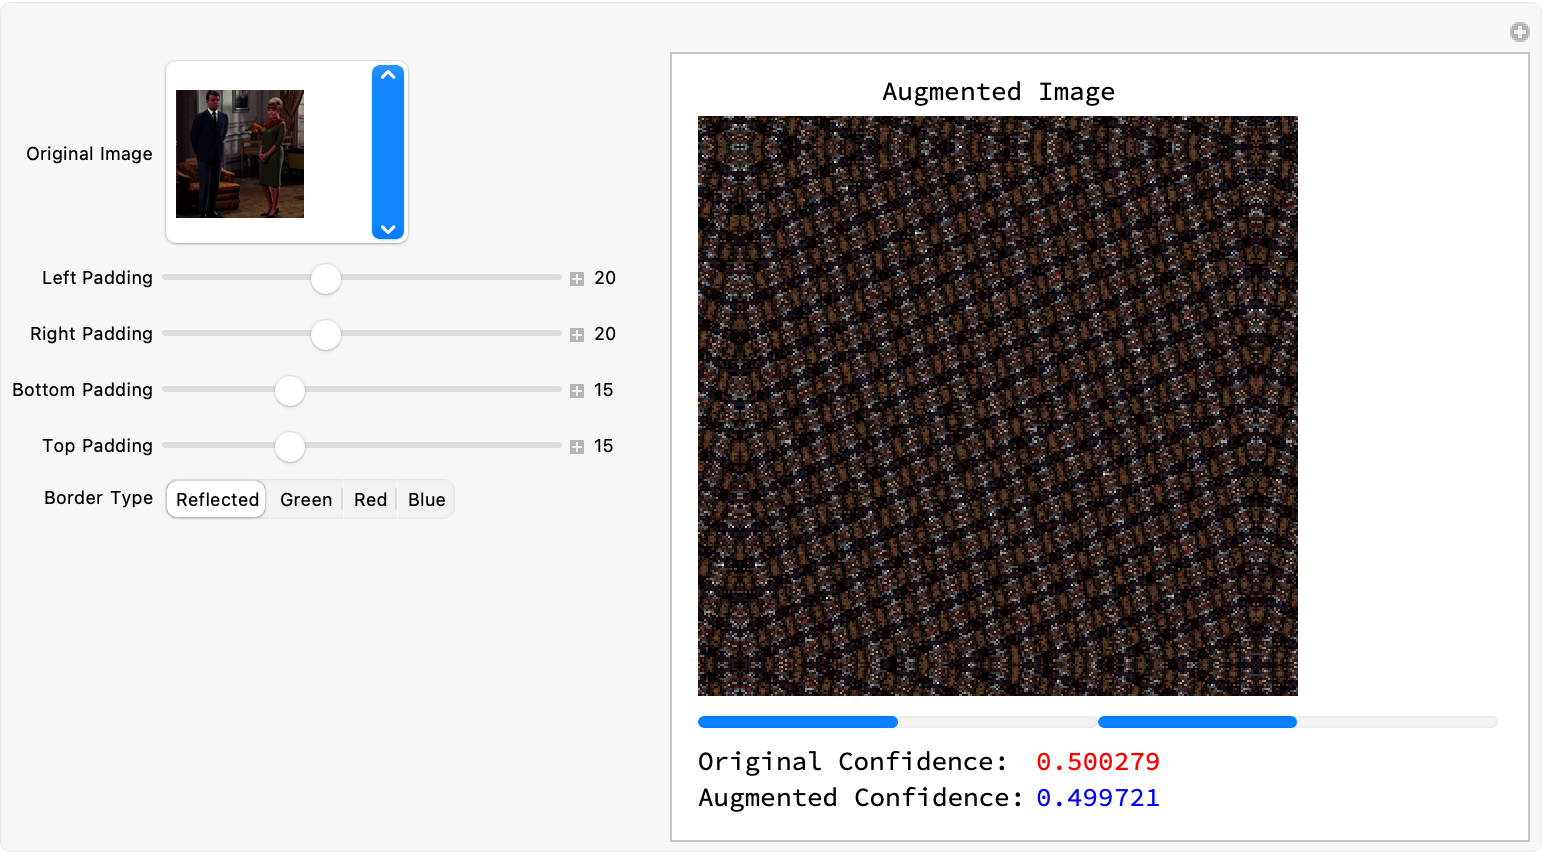
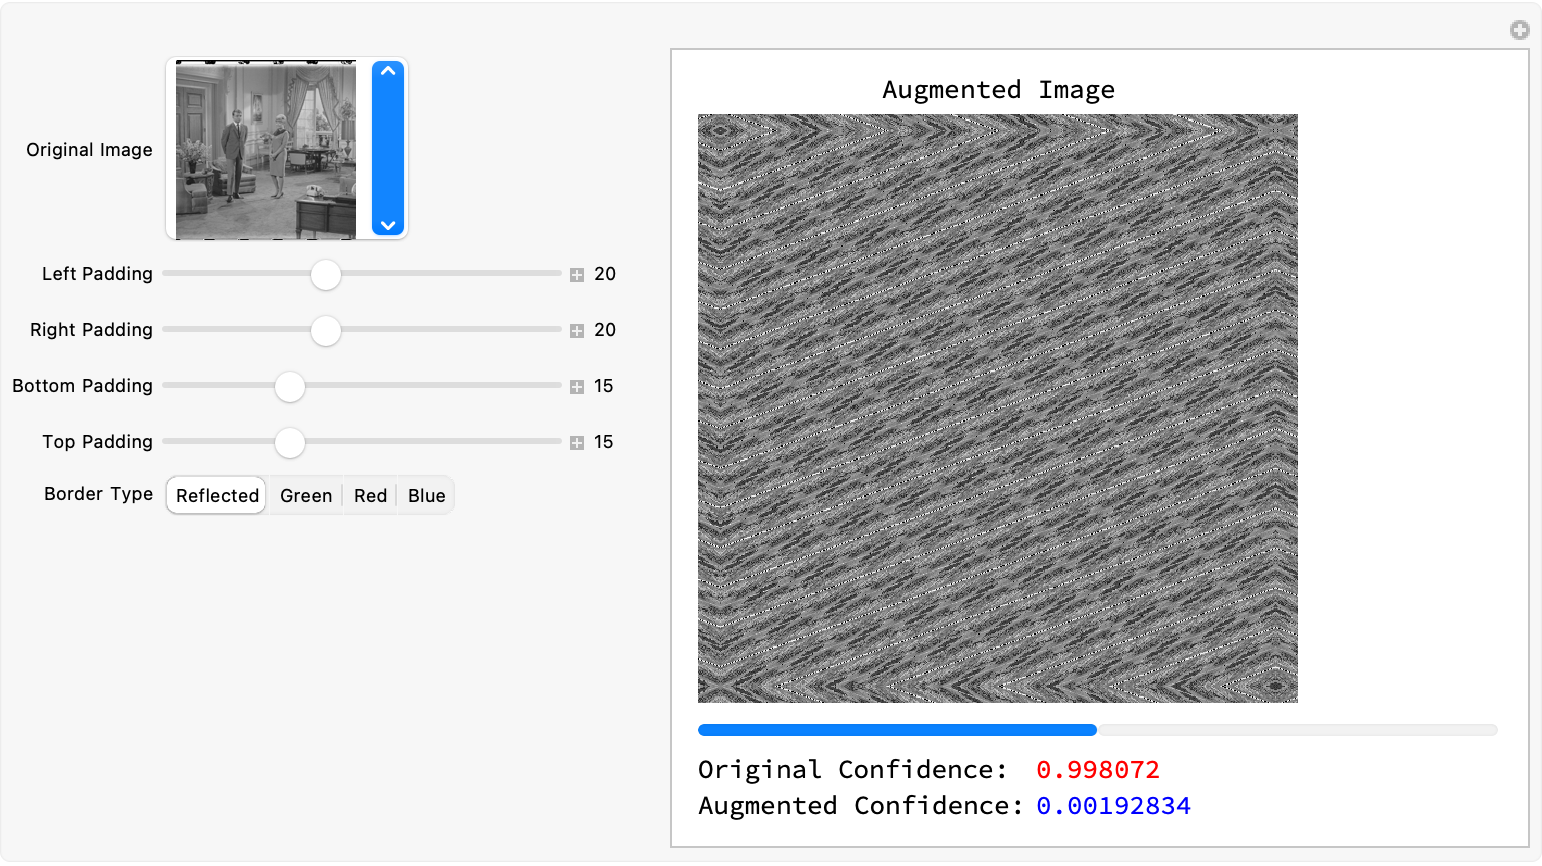
Therefore I think the augmentation preserving structural elements of the image, we can have a modular interface to experiment with augmentation methods. The steps..the extraction of pixel values "out of" the borders of the source image and their utilization to pad the image...that's why we have all these styles in the getPadding function. Because then we can do Red Green Blue and Reflected, in the getPadding function and then interactively demo the creation and annihilation of padding parameters via sliders and select different padding modes and modals..the application of the perspective transformation is demoed via the padding and then the image self-resizes for the network input; the network's prediction, is displayed alongside the augmented image, which builds us real-time visual feedback.
The affect of the neural networks' predictions, the preservation of the structural integrity of the image, is important;;in the sense that the integration of the outputs of the card game rounds and the classification modules into a "comprehensive" image summary report...we can generate an image summary report in a new notebook. But first, we have this cat thing which means that the cats, we start out with this "clock" shape. Then we automatically generate, the game rounds because we can utilize the image classification, not just for scenery or for photographs of cats as they accumulate alongside the classification grid and summary statistics, we've got the cumulative scores and predictions. That's why we put it all together, so that we can get this image summary report.
The following you will serve up this final notebook, it's going to be a self-contained report that documents both the interactive experiments and the quantitative results obtained from our image classification and augmentation experiments. I think that, and this is for the McGee edith.endlife.info crowd (you know those LifeLine spammers who keep asking if we need cremation expenses help) and I always have to tell them, I already generated all these thumbnails, I don't need to be cremated just yet. That's something that I would only do what, once per semester. What I really need is some thumbnails; the moderators, they "rummaged' as they should and saw my Lena photos and they got rid of them. And so I demonstrate how a flexible machine learning pipeline can be applied to a broader set of images, so it's not just the numerological aspect of the things that we demonstrate..if I type it'll only ever be pseudo-random. What it takes is a combination, of new image thumbnail fetching, advanced augmentation techniques, and interactive visualization that provide a powerful toolkit for computationally exploring the backstory of image transformations on network performance. This is also for the fans of Wolfram Mathematica with its unexpected backstory; it's the approach that we "take" and we understand how our models of physics can perform robust computations via a variety of augmentations. This, is how we open the door for future research into more sophisticated techniques for automated image summarization, and thumbnail generation. Once I get all these thumbnails then I'm ready for universal computation.
edgePadding[image_][pt_] :=
  Module[{w, h, x, y}, {w, h} = ImageDimensions[image]; {x, y} = pt;
   x = Clip[x, {1, w}];
   y = Clip[y, {1, h}];
   ImageData[image][[Round[y], Round[x]]]];
getPadding[padName_, image_] :=
  Switch[padName, "Reflected", "Reflected", "Extend",
   edgePadding[image], "Green", Green, "Red", Red, "Blue", Blue, _,
   "Reflected"];
images = ExampleData /@ ExampleData["TestImage"][[;; 20]];
wreckThumbnail[thumbnail_] :=
  ImagePerspectiveTransformation[thumbnail,
   RandomReal[{-0.1, 0.1}, {2, 2}], Padding -> "Reflected"];
augmentedImages = wreckThumbnail /@ images;
labeledData =
  Join[Thread[images -> "Original"],
   Thread[augmentedImages -> "Augmented"]];
{trainingSet, validationSet} = TakeDrop[RandomSample[labeledData], 30];
net = NetChain[{ConvolutionLayer[8, {3, 3}, "Stride" -> 2], Ramp,
    PoolingLayer[{2, 2}], ConvolutionLayer[16, {3, 3}], Ramp,
    PoolingLayer[{2, 2}], FlattenLayer[], LinearLayer[32], Ramp,
    LinearLayer[2], SoftmaxLayer[]},
   "Input" -> NetEncoder[{"Image", {192, 143}, ColorSpace -> "RGB"}],
   "Output" -> NetDecoder[{"Class", {"Original", "Augmented"}}]];
trainedNet =
  NetTrain[net, trainingSet, ValidationSet -> validationSet,
   MaxTrainingRounds -> 5, BatchSize -> 8];
Manipulate[
 Module[{transformed, augmentedImg, displayImg, resized, prediction},
  transformed =
   ImagePerspectiveTransformation[img,
    RandomReal[{-0.1, 0.1}, {2, 2}], Padding -> "Reflected"];
  augmentedImg =
   ImagePad[transformed, {{padLeft, padRight}, {padTop, padBottom}},
    Padding -> getPadding[padType, transformed]];
  displayImg = augmentedImg;
  resized = ImageResize[augmentedImg, {192, 143}];
  prediction = trainedNet[resized, "Probabilities"];
  Column[{Labeled[Image[displayImg, ImageSize -> 300],
     "Augmented Image", Top],
    Row[{ProgressIndicator[prediction[[1]], {0, 1}, ImageSize -> 200],
       ProgressIndicator[prediction[[2]], {0, 1}, ImageSize -> 200]}],
     Grid[{{"Original Confidence:",
       Style[prediction[[1]], Red]}, {"Augmented Confidence:",
       Style[prediction[[2]], Blue]}},
     Alignment -> Left]}]],(*Controls*){{img, RandomChoice[images],
   "Original Image"}, images,
  ControlType -> PopupMenu}, {{padLeft, 20, "Left Padding"}, 0, 50,
  Appearance -> "Labeled"}, {{padRight, 20, "Right Padding"}, 0, 50,
  Appearance -> "Labeled"}, {{padTop, 15, "Bottom Padding"}, 0, 50,
  Appearance -> "Labeled"}, {{padBottom, 15, "Top Padding"}, 0, 50,
  Appearance -> "Labeled"}, {{padType, "Reflected",
   "Border Type"}, {"Reflected", "Green", "Red", "Blue"}},
 SynchronousUpdating -> False, ControlPlacement -> Left,
 Paneled -> True]
So we've been just digging so long creating padding rules via the edgePadding function and then, the pixel values pop up at the image's border. And then with the power of Wolfram Language we just "suddenly" start returning pixel values of the nearest point within the image boundaries. That's how we know that when an image is padded using the mode "Extend", and "'Extend' is such a thing" as to repeat or stretch the edge pixels from the original image. It's sort of like having a wheelchair that just rolls and then you get up and say oh what changed, how does the pad type go from being reflected to returning color constants like Green or Red or Blue..what if no matching option is found? Well then, we do..we need to extract a. set of test images and then create an augmented version using a simple perspective transformation. And so we do, we load a list of 20 example images.
Just random number, 1.7284643, it could be a really complicated formula. It's sort of completely unsurprising that there's a really complicated formula that represents the six digits you typed into that number. If you really wanted a formula for 1.17 or something, after all the formula will be 1 + 1/10 plus 7/100. And it's just not telling one much because that's the number you put in. If the function I put in is wreckThumbnail then yes, it applies a small random perspective transformation to simulate an "augmented" (or "wrecked") version of each image. Then the dataset is then labeled as "Original" for unmodified images and "Augmented" for transformed images. Finally, the dataset is at last shuffled and split into training and validation sets.
How small can the description of your number be? I suppose that depends on all the possible numbers and digits..the playful approach that we take to image analysis by "drawing" cards from an online API and then using them as inputs for a series of low-level image processing and classification tasks. The goal is to see "how low can you go" so to speak to generate a summary report that combines two functionalities: playing a card game over multiple rounds (where each round includes an entropy analysis of the card image) and classifying a set of cards as "Good" or "Bad" based on deterministic rules. We have a way of getting a proxy for word-smithing all the outputs into a neatly organized notebook report.
drawSingleCard[] :=
 Module[{deck, cards},
  deck = URLExecute[
    "http://deckofcardsapi.com/api/deck/new/shuffle/", {"deck_count" ->
       1}];
  cards =
   URLExecute[
    URLBuild@{"http://deckofcardsapi.com/api/deck",
      Lookup[deck, "deck_id"], "draw/"}, {"count" -> 1}];
  First@Cases[cards, Rule["image", url_] :> url, Infinity]]
drawCards[n_Integer] :=
 Module[{deck, cards},
  deck = URLExecute[
    "http://deckofcardsapi.com/api/deck/new/shuffle/", {"deck_count" ->
       1}];
  cards =
   URLExecute[
    URLBuild@{"http://deckofcardsapi.com/api/deck",
      Lookup[deck, "deck_id"], "draw/"}, {"count" -> n}];
  Cases[cards, Rule["image", url_] :> url, Infinity]]
predictCardValue[cardImage_] :=
 If[RandomChoice[{True, False}], "High Value", "Low Value"]
customImageEntropy[img_Image] :=
 Module[{gray, data, hist, probs},
  gray = ColorConvert[img, "Grayscale"];
  data = Flatten[ImageData[gray]];
  hist = Tally[Round[255*data]];
  probs = Last /@ hist;
  probs = probs/Total[probs];
  N[-Total[probs*Log2[probs]]]]
actualCardValue[cardImage_] :=
 Module[{img, entropy},
  img = If[ImageQ[cardImage], cardImage, Image[cardImage]];
  entropy = customImageEntropy[img];
  If[entropy > 4, "High Value", "Low Value"]]
playCardGame[numRounds_] :=
 Module[{score = 0, cardImage, prediction, actual, entropy, rounds},
  rounds = Table[cardImage = Import[drawSingleCard[]];
    entropy = customImageEntropy[cardImage];
    prediction = predictCardValue[cardImage];
    actual = actualCardValue[cardImage];
    score += If[prediction === actual, 1, 0];
    {i, cardImage, NumberForm[entropy, {3, 2}], prediction, actual,
     score}, {i, numRounds}];
  Grid[Prepend[
    rounds, {"Round", "Card Image", "Entropy", "Prediction", "Actual",
      "Cumulative Score"}], Frame -> All, Alignment -> Center,
   ItemSize -> All]]
classifyCards[] :=
 Module[{cardURLs, cardImages, cardLabels, goodCards, badCards, grid,
   summary}, cardURLs = drawCards[5];
  cardImages = Import /@ cardURLs;
  cardLabels =
   If[EvenQ[Hash[#, "MD5"]], "Good Card", "Bad Card"] & /@
    cardImages;
  grid =
   Grid[Transpose[{cardImages, cardLabels}], Frame -> All,
    FrameStyle -> LightGray, Spacings -> {2, 2}, Alignment -> Center,
    ItemSize -> {10, 10}];
  goodCards = Pick[cardImages, cardLabels, "Good Card"];
  badCards = Pick[cardImages, cardLabels, "Bad Card"];
  summary = <|"Number of Good Cards" -> Length[goodCards],
    "Number of Bad Cards" -> Length[badCards],
    "Result" ->
     If[Length[goodCards] > Length[badCards],
      "You Win! More good cards than bad cards.",
      "You Lose! More bad cards than good cards."]|>;
  Print["Card Classification Grid:"];
  Print[grid];
  Print["Summary Statistics:"];
  Print[summary];
  <|"Grid" -> grid, "Summary" -> summary|>]
gameRoundsGrid = playCardGame[5];
classificationReport = classifyCards[];
reportNotebook =
  CreateDocument[{TextCell["Card Game Image Summary Report", "Title"],
     TextCell["Game Rounds Summary", "Section"],
    ExpressionCell[gameRoundsGrid, "Output"],
    TextCell["Card Classification Summary", "Section"],
    ExpressionCell[classificationReport["Grid"], "Output"],
    TextCell["Classification Statistics", "Subsection"],
    ExpressionCell[classificationReport["Summary"], "Output"]},
   WindowTitle -> "Card Game Image Summary Report"];
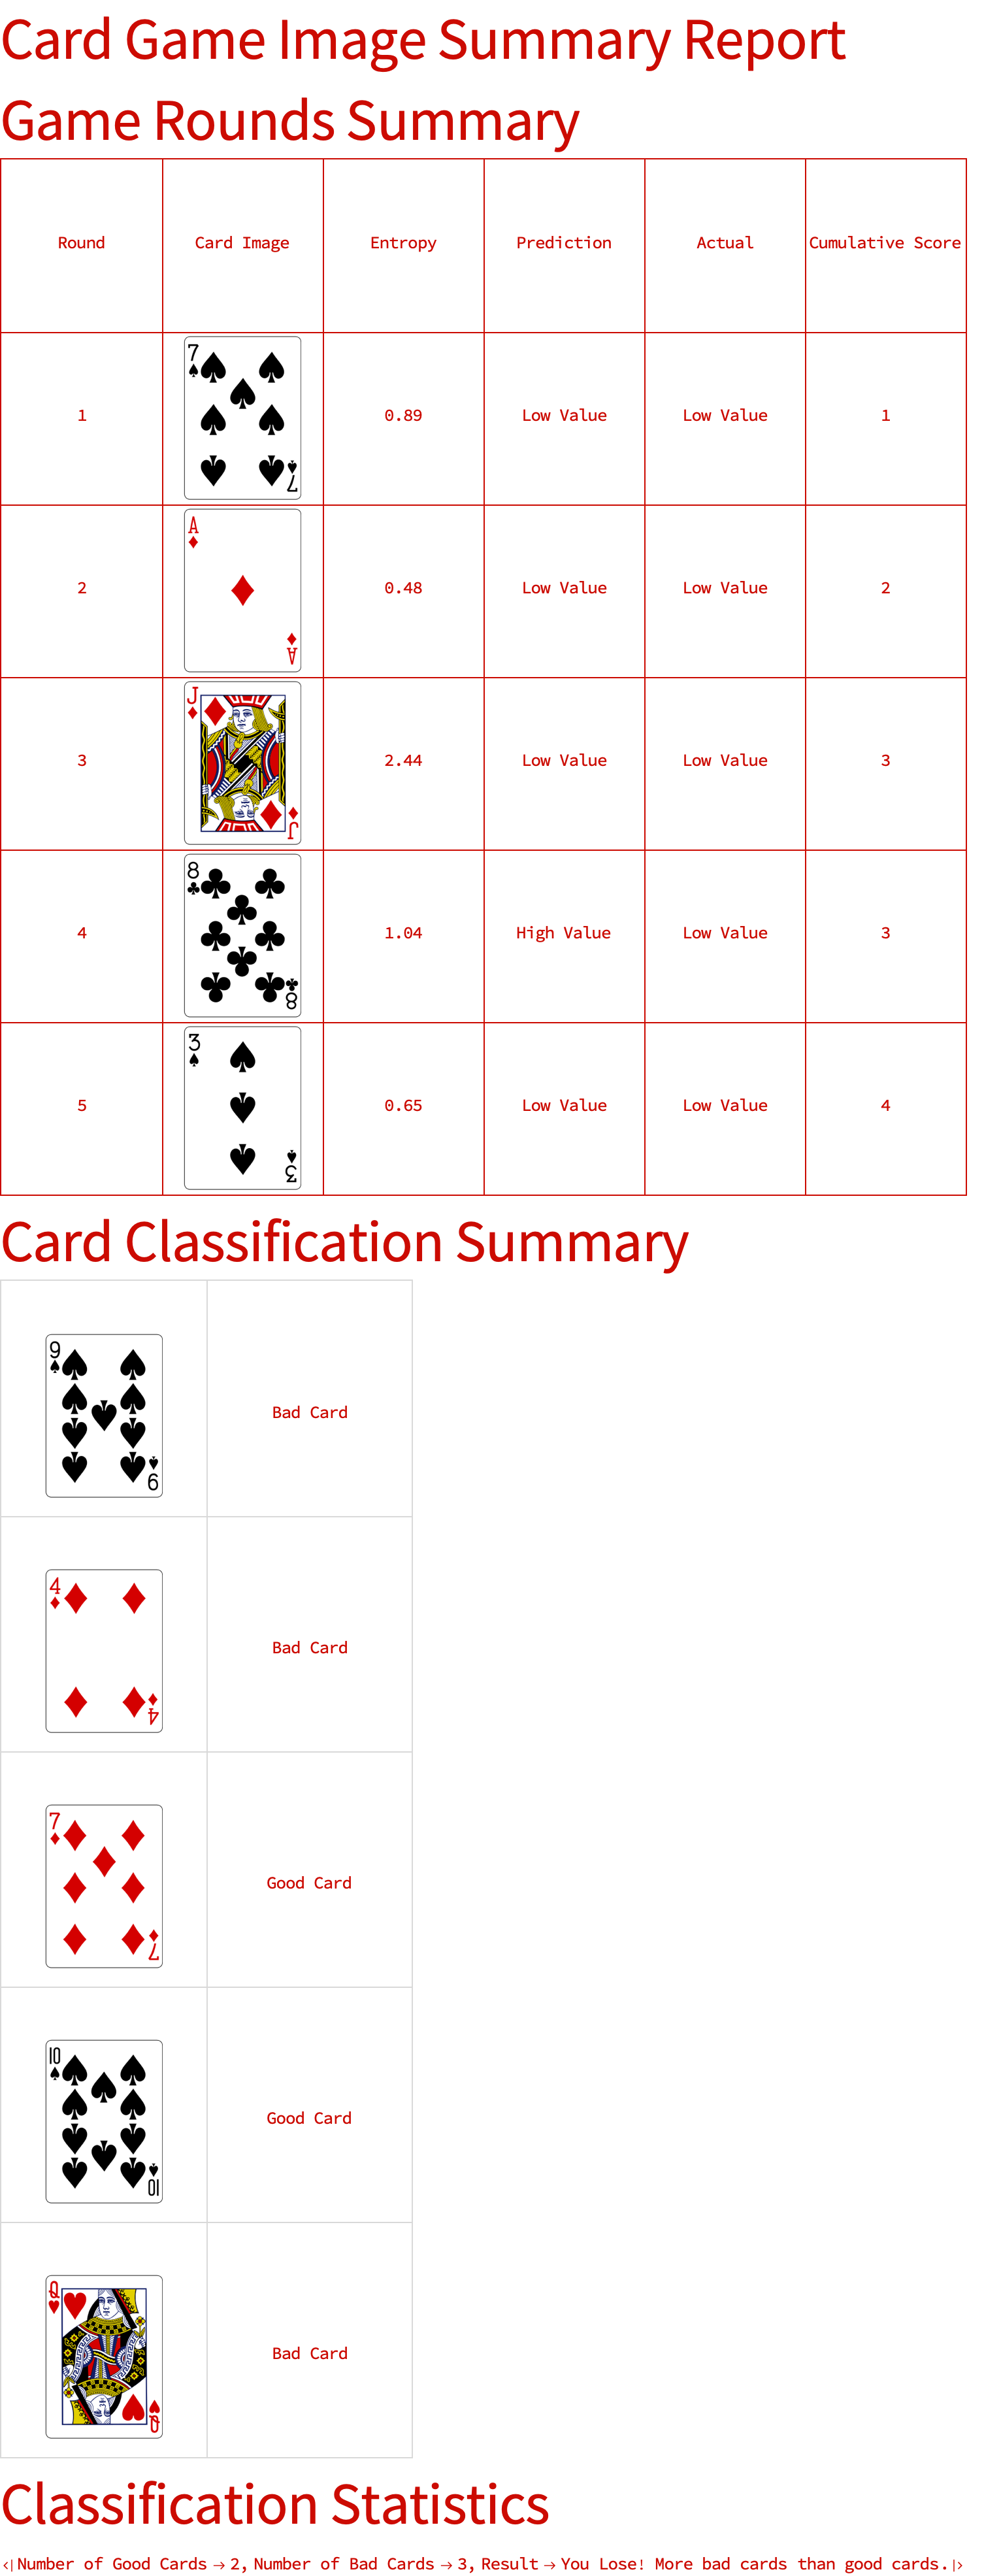
Okay, 12 and 8 are not relatively prime. 8 is 2 * 4, 12 is 3 * 4, those numbers have a divisor in common they are not relatively prime. Let's talk about 10 and buh buh buh..a new shuffled deck is created and a single card is drawn from the deck, and then the function extracts the card's image URL from the API response. Let's say I try a whole bunch of different numbers..drawCards unlike drawSingleCard does not ..it draws n cards and returns a list of image URLs. The functions that "predict" a card's value and compute a measure of the image's complexity using entropy, for demonstration purposes, the prediction we choose at random between "High Value" and "Low Value". The image we first convert to grayscale..its pixel values we extract & scale & bin into 256 discrete bins..and the histogram we use to calculate probabilities for each intensity value. Is that number a readily producible number or is it a number that doesn't have a short formula that I'm ever going to encounter, those are the numbers I'm unlikely to find. People often forget.that the higher entropy value indicates more complexity or "information content" in the image. The Shannon entropy we compute (in bits) and return as a decimal number. The function actualCardValue computes the card image's entropy and then determines the "actual" value of the card: if the entropy is greater than 4 (indicating high complexity), the card is labeled "High Value"; otherwise, it is labeled "Low Value".
deck = URLExecute[
"http://deckofcardsapi.com/api/deck/new/shuffle/", {"deck_count" ->
1}];
cards = URLExecute[
URLBuild@{"http://deckofcardsapi.com/api/deck",
Lookup[deck, "deck_id"], "draw/"}, {"count" -> 4}];
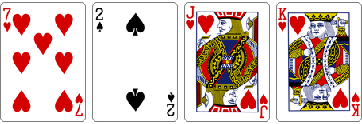
exampleNb =
Thumbnail /@
URLExecute@Cases[cards, Rule["png", url_] -> url, Infinity]
This is my favorite part of creating thumbnails, it's the compression after upload and replacing of the original image for which we need to watch for storage upload to trigger our functions and create the thumbnail, agreed? Making thumbnails accessible through the cells in a Wolfram Notebook.


