Okay. Your hypothesis is that in a GraphicsGrid, the presence of a Null in one "cell" of the grid causes extra spacing to occur in an adjacent "cell". Let's test that:
b = Table[Plot[Sin[x], {x, 0, 3}], {b, 5}];
Now, let's try all six possible positions for Null:
GraphicsGrid[Partition[Insert[b, Null, 1], 3], ImageSize -> Full]
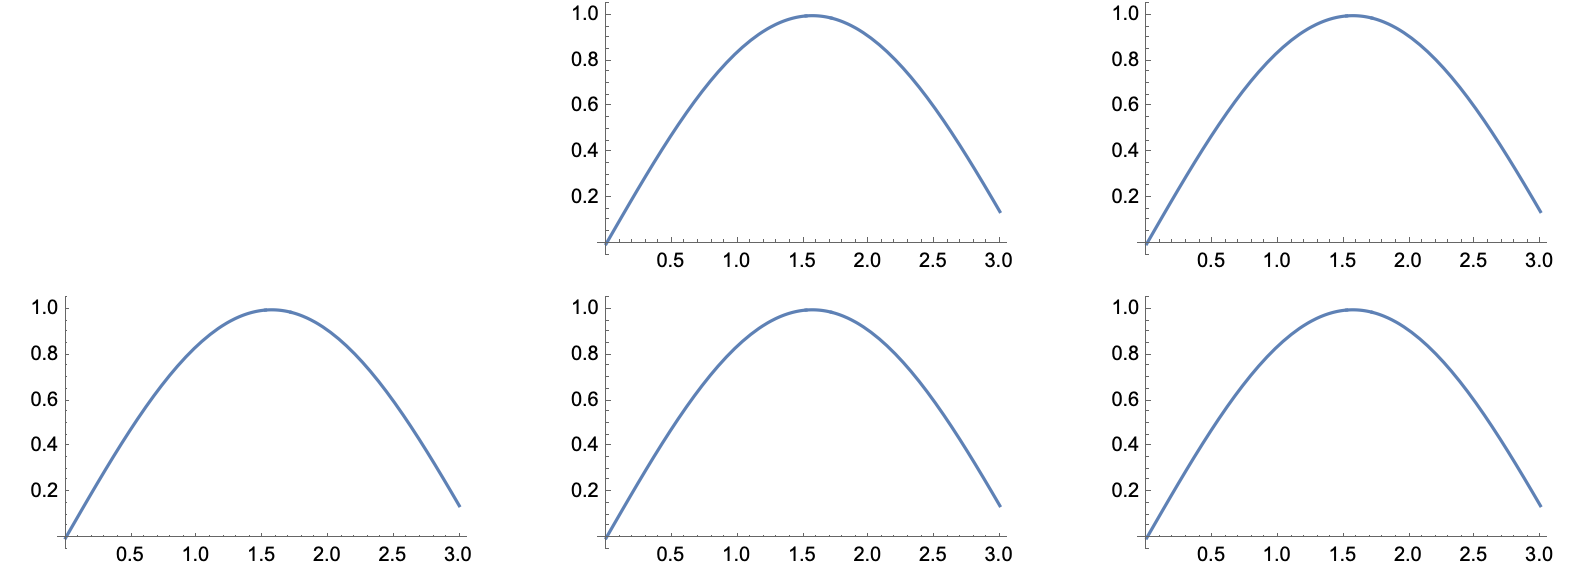
GraphicsGrid[Partition[Insert[b, Null, 2], 3], ImageSize -> Full]
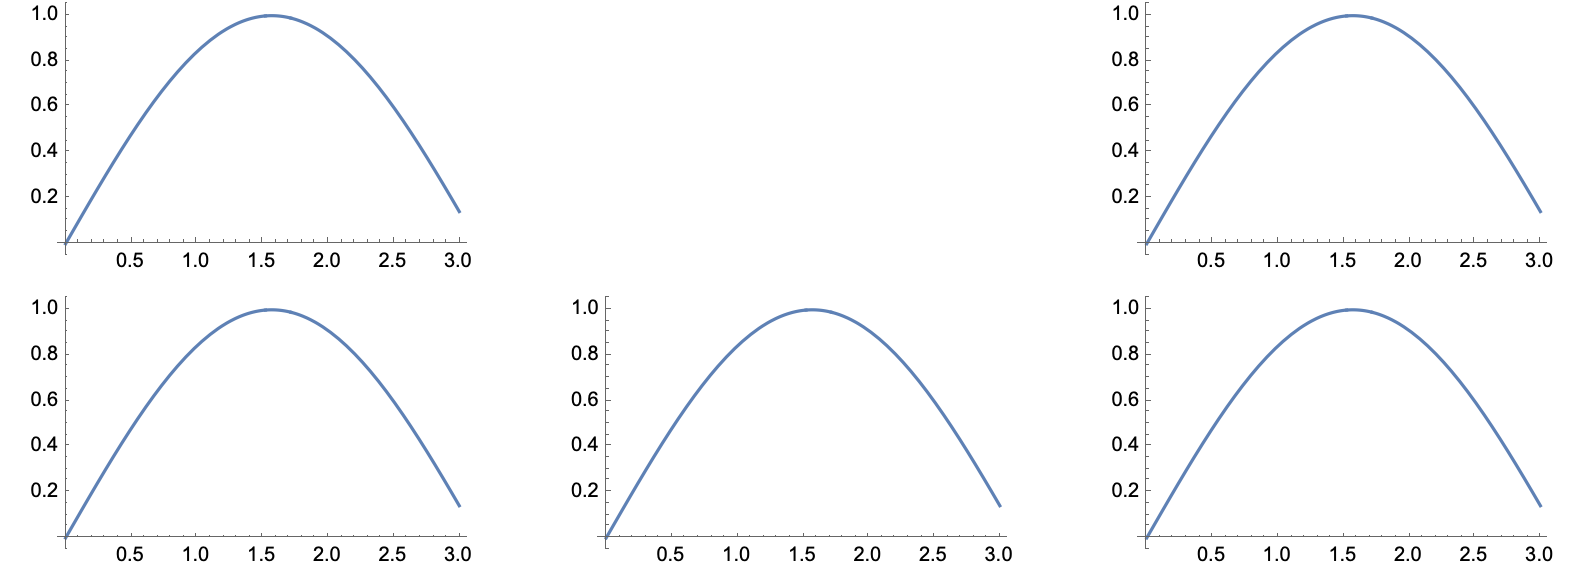
GraphicsGrid[Partition[Insert[b, Null, 3], 3], ImageSize -> Full]
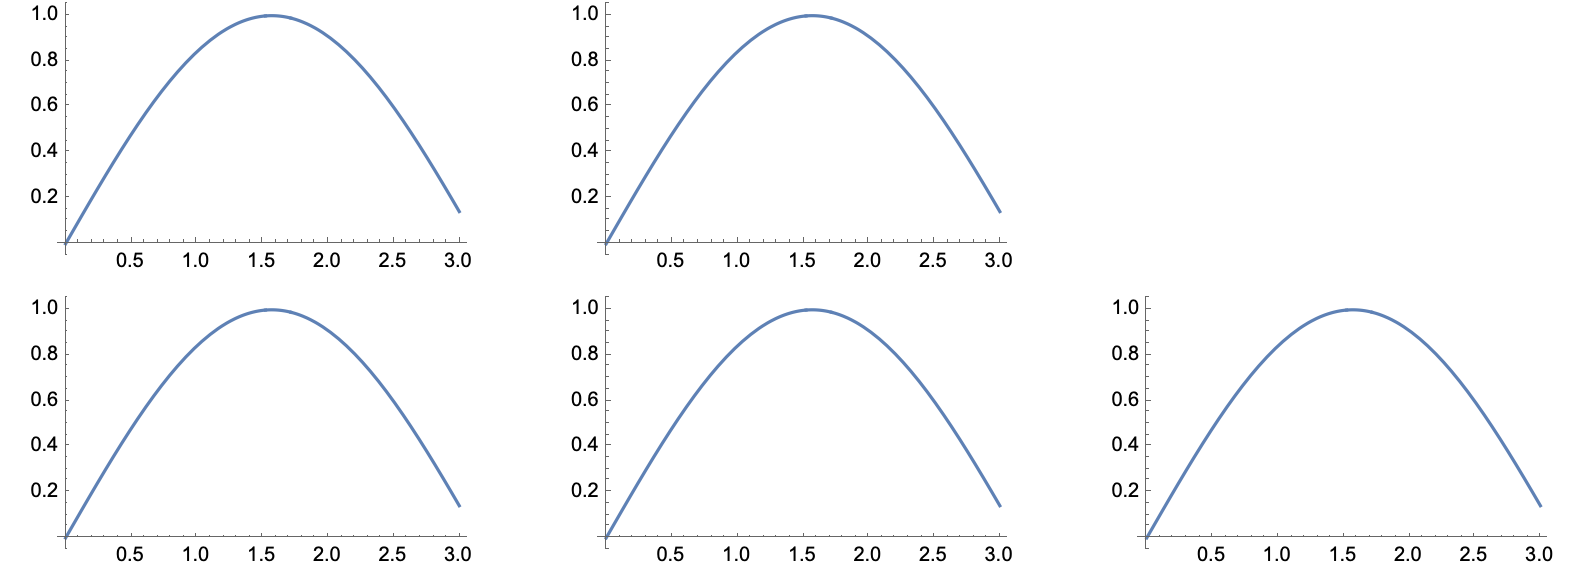
GraphicsGrid[Partition[Insert[b, Null, 4], 3], ImageSize -> Full]
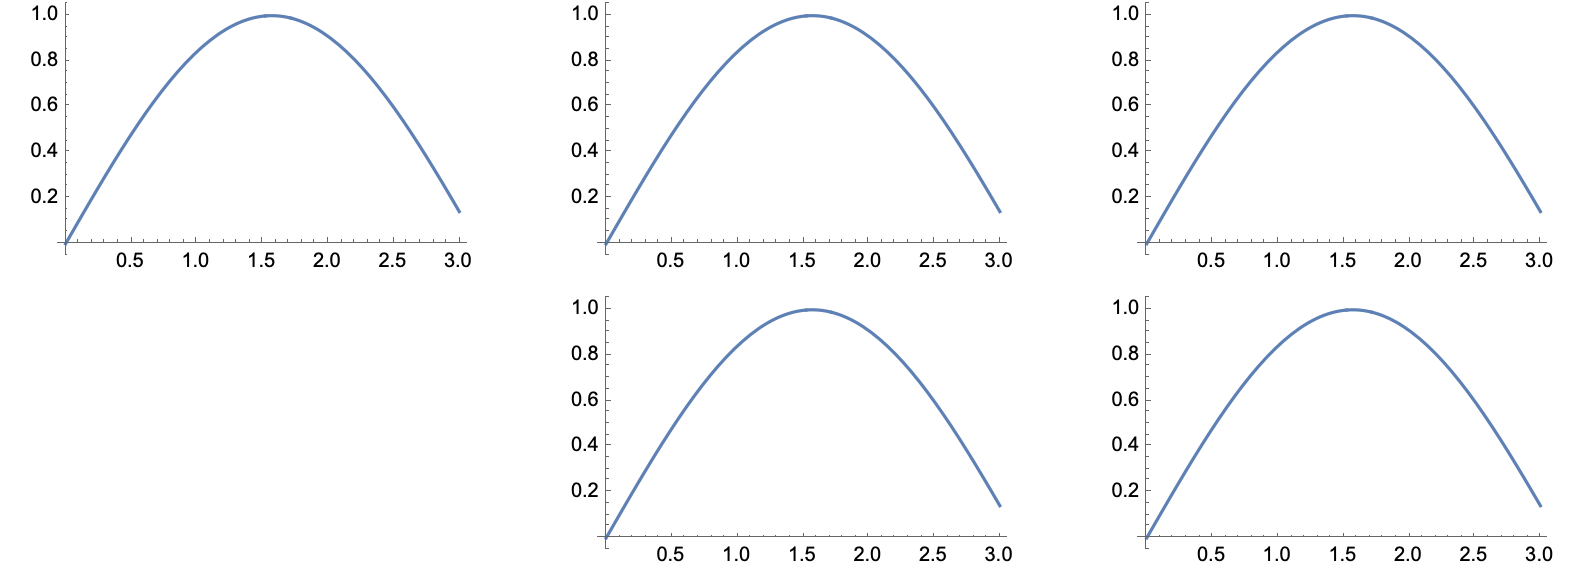
GraphicsGrid[Partition[Insert[b, Null, 5], 3], ImageSize -> Full]
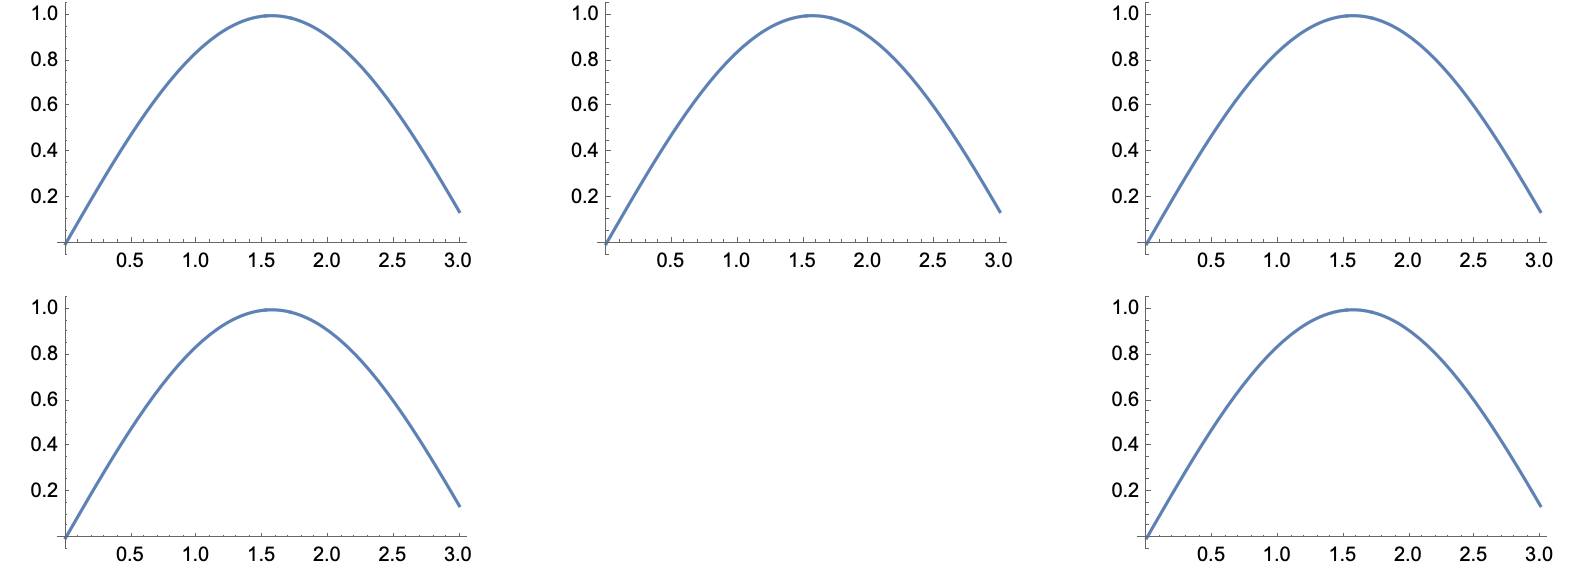
GraphicsGrid[Partition[Insert[b, Null, 6], 3], ImageSize -> Full]
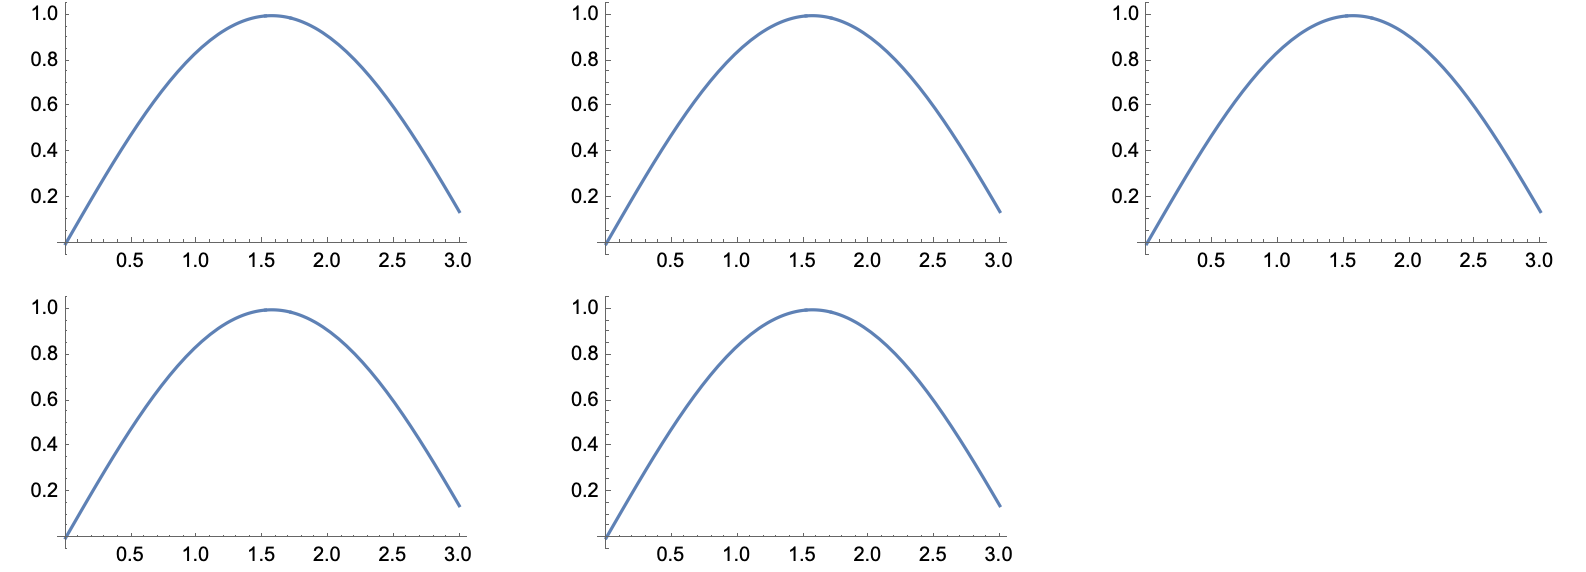
Your eyes are probably better than mine. Please point out to me which one of these images shows that extra space was added. If the spacing in these images was not affected by Null, then what could have affected the spacing in your original example? It seems like a reasonable conclusion to me that it has something to do with scaling different images to fit the grid.
Furthermore, your examples actually support MY hypothesis. In your latest example, you show one grid where padding seemed to be added and one where it was not. In the grid with extra padding, it was placed in a row where one image had tick marks at the bottom and the rest did not. In the grid with no extra padding, every element in each row of the grid was the same in this regard. Furthermore, in the second grid, PADDING WAS ADDED EXACTLY AS I PREDICTED. The padding between ROWS is now larger. You don't seem to care about that spacing, but it is there. The horizontal padding is due to one of the plots having a thinner aspect ratio. The vertical padding is due to 5 of them having wider aspect ratio.